
Retrieve Facebook & Instagram data#
Show me the most successful post of the month. How do we compare to the others? How is our follower count developing? What can we do better?
Danny Data answers these questions with the Meta tool, which connects him directly to your station’s Facebook and Instagram accounts.
This allows the AI to independently retrieve performance data, analyze it, and turn it into meaningful charts - without you having to navigate through Facebook Business Manager or Instagram Insights yourself.
This is what makes the Meta Connector especially powerful:
Everything in one chat: You ask for metrics in plain language, the AI fetches the relevant data and delivers the answer directly in the chat.
Multiple sources combined: Organic reach, paid advertising, follower growth and competitor data can be linked and viewed together in the same conversation.
From numbers to charts: The AI creates visualizations directly from the raw data using the Charts tool instead of just outputting tables.
Specific recommendations for action: The AI evaluates the figures and gives your social media team practical tips on what could work better in the next content planning round.
Note
The Meta Connector works with a data store that is updated automatically on a regular basis. The figures are therefore not live in real time, but reflect the status of the last sync.
Channels and brands#
Before you query data, the AI needs to know which station or brand you mean. To do this, it first checks which accounts are set up in your organization and which platforms (Facebook, Instagram, ads) have data available.
You do not need to trigger this step yourself - if you ask, for example, “How is our Instagram performing?”, the AI automatically identifies the correct account in the background. If several brands or stations are managed in your organization, it is best to mention the name directly, for example: “Show me the Facebook figures for HIT RADIO FFH.”
Organic reach and engagement at a glance#
For a quick overall impression, the AI retrieves aggregated metrics such as reach, views, likes, engagement, and follower count for a specific period.
You can use both relative time periods (for example, “the last 30 days”) and fixed periods in the past (for example, “April 2026”). This is well suited for:
the weekly or monthly performance check
the comparison “this week vs. last week”
preparing an internal report
Tip
Feel free to ask for an interpretation right away, for example: “How has our Instagram reach developed compared to the previous month, and what could be the reason for that?” The AI compares the figures and provides a brief explanation.
Find the strongest posts#
The AI can list the best posts, reels, or stories from a given period, sorted by a specific metric such as views, reach, or interactions. You receive not only the ranking metric, but also all available metrics for each post in table form.
For individual metrics, the AI also shows a value “as a percentage of reach.” This is helpful because it lets you compare posts with very different reach more fairly - a smaller post with a high interaction rate will not be overlooked.
Typical questions include:
“Which 10 Instagram posts from the last 90 days had the most views?”
“Show me the reels with the best interaction rate relative to reach.”
“What were our weakest Facebook posts last month?”
Examine individual posts in detail#
If you want to analyze a specific post in more detail, you can specify it via link or post ID. The AI will then provide either:
the complete raw data as a table (also for multiple posts at the same time), or
a visual preview card with preview image, text, and the most important metrics if you want to see the post instead of just reading the numbers.
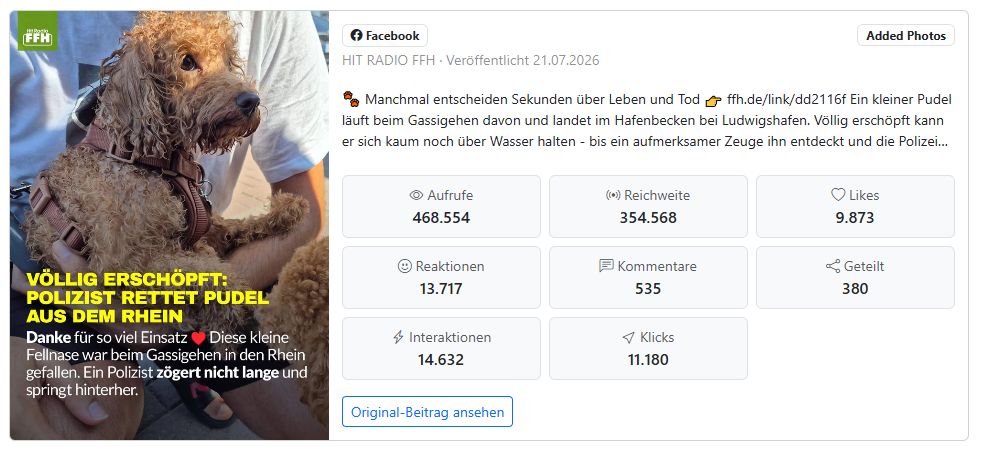
The preview card shows the post image, the platform, the published text, and the key metrics such as views, reach, likes, reactions, comments, shares, interactions, and clicks. You can use the button to go directly to the original post.
Tip
For example, ask: “Show me the Facebook post about the rescued poodle and how it performed.” The AI finds the matching post and shows you the preview card directly in the chat.
Track follower growth#
In addition to individual posts, the AI can also retrieve follower count over a period as a time series and calculate net growth. This is useful for seeing whether a campaign or a content series actually brought in new followers.
Example: “How has our Instagram follower count developed since the beginning of the year?”
Analyze ads#
Have the AI evaluate paid posts: spend, impressions, reach, clicks, and the derived metrics CTR, CPC, and CPM - each by campaign.
You can also limit the analysis to a specific campaign, for example: “How did our ‘Summer Giveaway’ campaign perform on Facebook?”
Note
This function is only available for brands that have an ad account set up in Meta Business Manager.
Keep an eye on the competition#
How are the others doing? The Meta Connector can retrieve public metrics from other brands and compare them with your own account. This includes follower count, number of posts, and follower growth. At the moment, this works for Instagram.
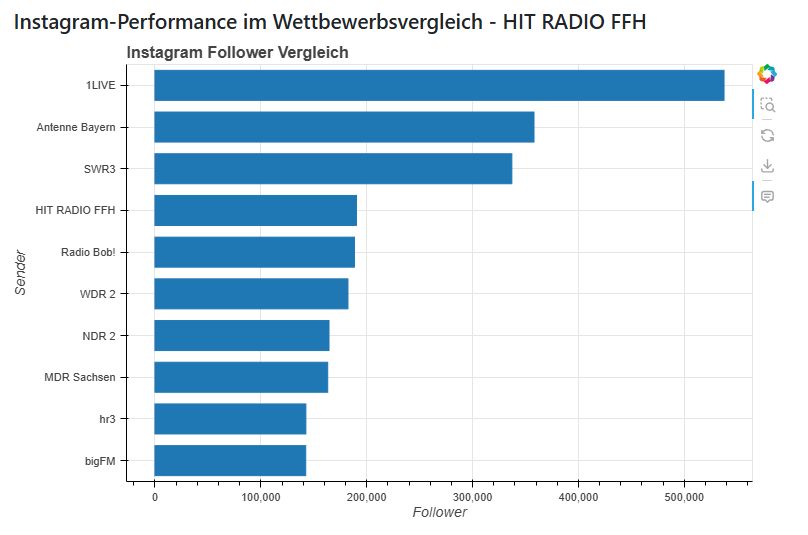
The example shows a follower comparison of several radio stations on Instagram as a horizontal bar chart. At a glance, you can see where your station stands compared to the competition.
Example prompt: “Compare our Instagram follower count with our competitors and show it as a bar chart.”
Identify patterns and cluster content types#
The real strength of the Meta Connector becomes clear when the AI combines multiple data points and derives patterns from them - for example, which content types perform particularly well.
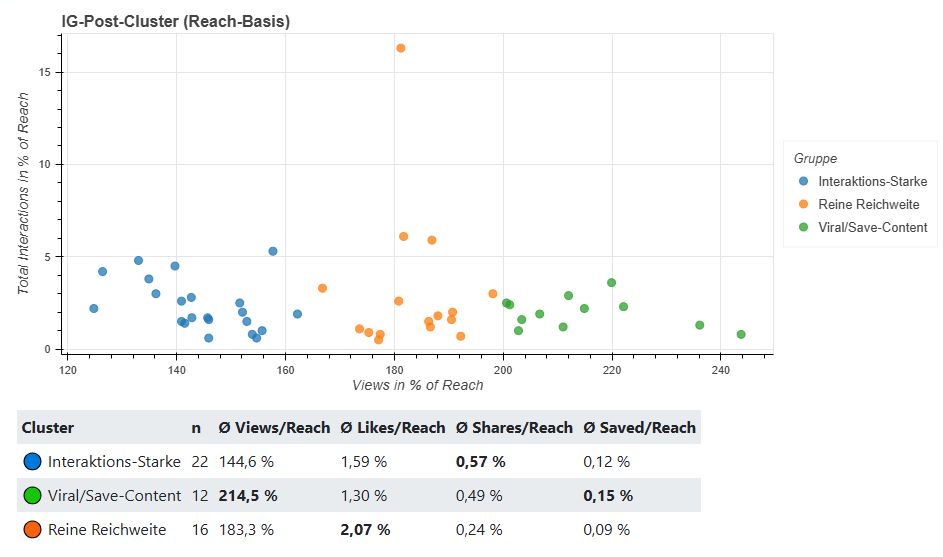
In this example, the AI grouped Instagram posts from a given period by views and interactions relative to reach and formed three clusters:
“High Interaction”
“Pure Reach”
“Viral/Save Content”
The table below shows, for each cluster, the number of posts as well as the average value for each metric. This lets you see at a glance which content type tends to drive interaction and which tends to deliver pure reach.
Such an analysis can be used to derive direct recommendations for action, for example: planning more posts in the style of the “Viral/Save Content” cluster if this type is saved and shared more often than average.
From data to charts#
Aus den Rohdaten oder Vergleichstabellen kann die KI über das Charts-Tool passende Visualisierungen erzeugen - Balkendiagramme, Zeitreihen, Streudiagramme und mehr, je nachdem, welche Darstellung zur Fragestellung passt.
You do not need to specify a chart type. It is enough to describe the goal, for example:
“Show the reach trend over the last 3 months in a chart.”
“Display the top 10 posts by interaction rate as a bar chart.”
“Visualize how our follower count has developed compared to our competitors.”
Tip
Feel free to ask the AI directly for an interpretation in addition to the chart, for example: “…and also tell me what that means for our content planning.” This way, you get not only the graphic, but also a concrete recommendation for the social media team.
Prompts to try right away#
These example prompts show the different ways you can use the Meta Connector in everyday work:
“How has our Instagram performed over the last 30 days, and what should we do differently next week?”
“Which Facebook posts from the last 2 weeks had the best interaction rate relative to reach?”
“Compare our reach on Instagram with our main competitors and show it as a chart.”
“How did the budget of our summer campaign affect the cost per click?”
“Group our Instagram reels from the last 90 days by performance type and explain what the most successful ones have in common.”
“Show me the post with the most comments last month as a preview.”
Note
The more specific your question is in terms of time period, platform, and metric, the more precisely the AI can retrieve the right data. If you are unsure, a general question is also enough - the AI will ask follow-up questions if needed or choose sensible default values.
Set up the connection to Meta#
If you want to retrieve Facebook and Instagram performance data for your station’s own accounts in the AI-Tools, you need your own connection to Meta. To do this, you create an app in your Meta developer account and generate a system user token through it.
The process takes place entirely on Meta’s side and is somewhat cumbersome. The following guide walks you through the setup step by step.
Note
Before you start, the following prerequisites should be met:
All of your station’s Facebook and Instagram accounts are bundled in a shared Meta Business Suite.
There are at least two users with full access to this Meta Business Suite.
At least one user has a Meta developer account. This can be set up quickly with a valid Facebook account.
At the end of the process, you send three values to the Radio Creator team: system_user_token, app_id, and app_secret.
Step 1: Create a Meta app#
First, create a new app in your developer account. This app is the technical foundation through which data access will later run.
If you do not yet have a developer account, first register as a Meta developer:
https://developers.facebook.com/documentation/development/register
Then go to the app creation section:
https://developers.facebook.com/apps/creation/
Create a new app there with the name “AI-Tools”.
Immediately after creating it, note down the values
app_idandapp_secret. You can find them in the app settings.
You can find further information about app creation in the Meta documentation:
Create an app with Meta: https://developers.facebook.com/documentation/development/create-an-app
App creation step by step: https://developers.facebook.com/documentation/development/create-an-app#app-creation-steps
Create app: Let’s get started#
Add use cases#
Select All.
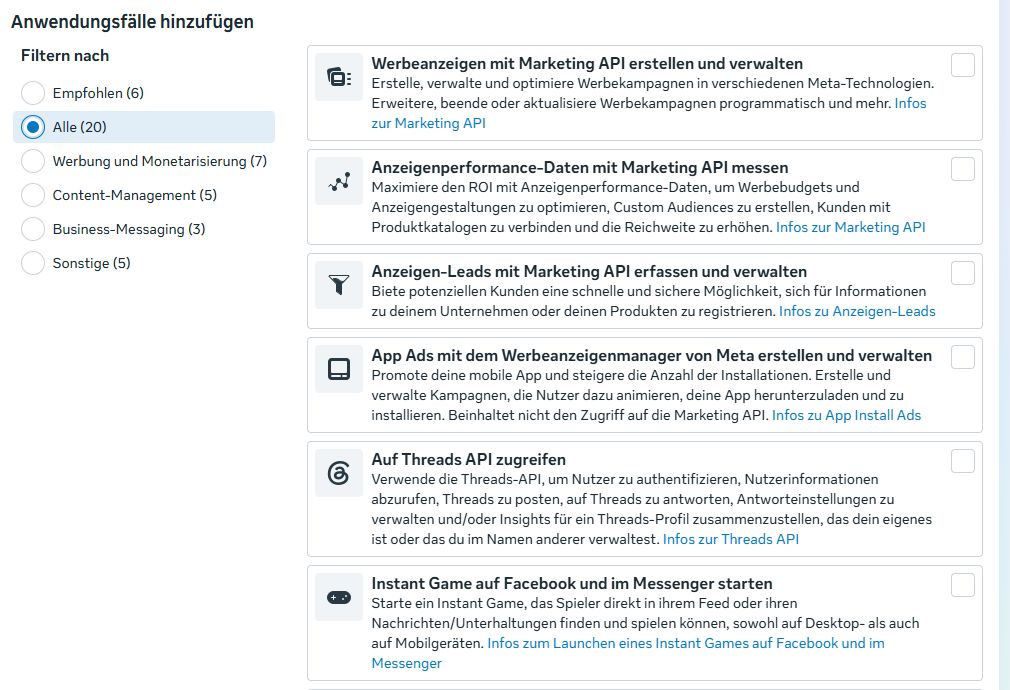
Select all three of the following options:
Measure ad performance data with the Marketing API
Manage messaging and content on Instagram
Manage everything on your page



This already sets some of the permissions. However, we still need to adjust them further.
Click Next and select the business portfolio the app should be linked to. Your user account must be connected to that business portfolio.

Then click Create app. This creates the app.
To set the remaining permissions for our analytics app, go to Use cases > Customize.
In the drop-down menu, select Instagram API. You can skip Measure ad performance. All permissions are already set there.
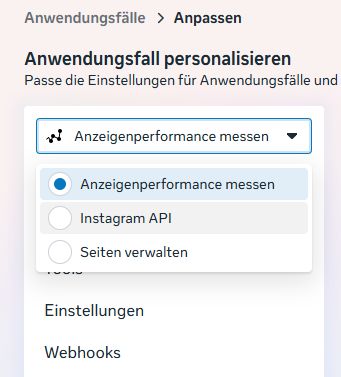
Then click Permissions and Features. This takes you to the individual permissions we need for the analytics app.
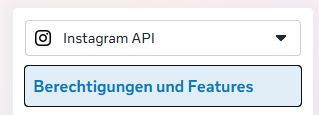
You still need to activate the following two permissions by clicking the Add button:
instagram_basicinstagram_manage_insights


On the left, select Manage Pages in the drop-down menu and go to Permissions and Features again.
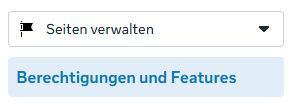
Here we need three additional permissions:
read_insightspublic_profilepages_read_user_content



This should give us the following permissions for the analytics app:
Use case |
Required permissions |
|---|---|
Manage Pages (Facebook Login for Business) |
|
Instagram Graph API |
|
Measure ad performance (Marketing API) |
|
In the main menu, go to App Settings and select Basic.
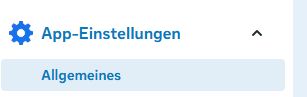
There you will find the values App ID and App Secret. Note them down - we will need them later.

Now enter the URL of your station’s privacy policy. Meta requires this information even though we are only retrieving data.

Don’t forget to save.

Step 2: Generate a system user token#
In the second step, you create a system user in Meta Business Suite, link it to your app and the social media accounts, and generate the actual access token through it.
Background information can be found here:
Add a system user to the business portfolio: https://de-de.facebook.com/business/help/503306463479099?id=2190812977867143
Add an app to the business portfolio: https://de-de.facebook.com/business/help/2199735813629697?id=420299598837059
Video tutorial for token generation: https://developers.facebook.com/docs/news-indexing/guides/access-tokens?locale=de_DE#videotutorial-zur-token-generierung
Create a system user and assign assets#
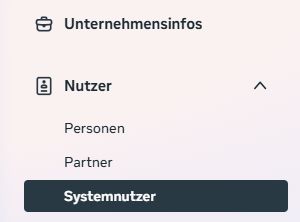
In Meta Business Suite, go to Business Settings and create a new system user. You can choose any name you like, for example “ai_tools_system_user”. Assign the role Admin:
Role: Admin
Then assign the app to this system user as an asset:
Business Settings → Users → System Users → select the system user
Click the “Assign assets” button
Select the “Apps” tab
Select the “AI-Tools” app
Enable the “Manage app” (Full Control) role so that the system user has full API access
Save
After that, assign the Facebook pages and Instagram accounts to the system user for which data should later be retrieved. You do this via the “Pages” and “Instagram Accounts” tabs in the same place.
Each account also needs the appropriate permissions so that the AI can retrieve performance data. You can still change this later if you want to add more accounts in the future.
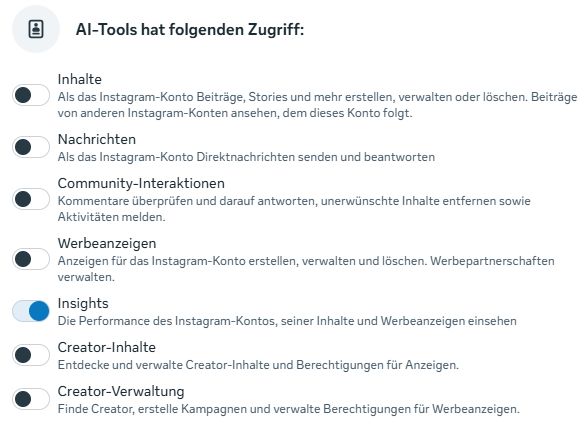
Display the Assigned assets and go through each Facebook page and each Instagram account. Click Manage for each one.
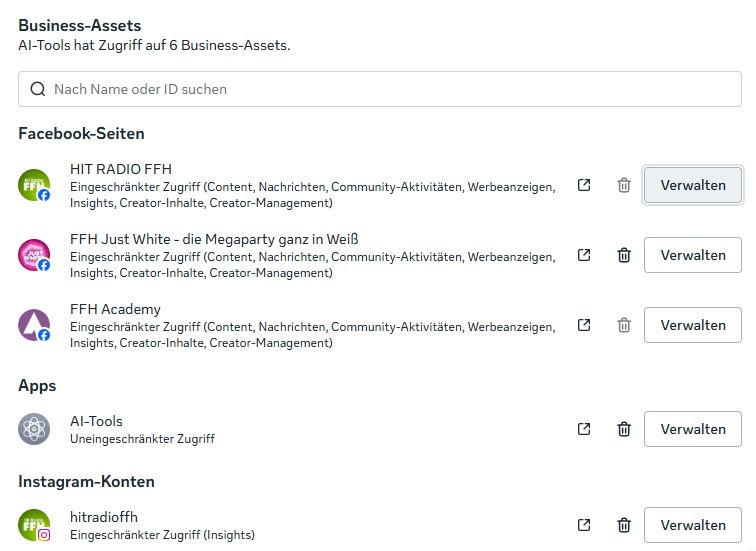
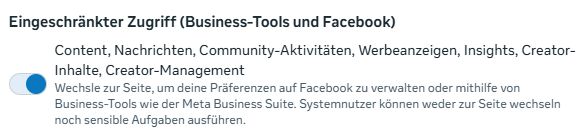
Facebook pages require the Limited access toggle.
Instagram accounts require the Insights toggle.
Generate token#
As soon as the app and accounts have been assigned to the system user, you can generate the token:
Click “Generate new token” for the system user
Select the “AI-Tools” app
Set the expiration date to “Never”, since the AI-Tools use the token permanently for server-to-server operation
Assign the permissions granted earlier. Select each of the following:
ads_read,ads_management,business_management,instagram_basic,instagram_manage_insights,pages_read_engagement,pages_show_list,pages_read_user_content,read_insightsGenerate token
Tip
Copy the token immediately after it has been generated and store it securely. For security reasons, Meta will not display it again afterwards.
Note
A second user with admin rights must give final confirmation for the token creation. They will automatically receive an email from Meta for this purpose.
Step 3: Send the values to the Radio Creator team#
Finally, send the generated values to the Radio Creator team. We will use them to set up the Meta Connector for your station.
Submit the following once:
Value |
Source |
|---|---|
|
The token generated in step 2 |
|
From the app settings (step 1) |
|
From the app settings (step 1) |
In addition, for each Facebook and Instagram account from which data is to be retrieved, we need the following information:
Field |
Example |
Description |
|---|---|---|
|
HIT RADIO FFH |
Name of the account in the AI-Tools |
|
123456789 |
ID of the Facebook page |
|
1234567890123 |
ID of the linked Instagram business account |
As soon as we have these values, we will set up the connection and the performance data will be available to you in the AI-Tools.
Synchronizing the data#
Meta only allows a certain quota of API requests per minute. Individual requests are also relatively slow. That is why the data is not retrieved live in real time, but synchronized automatically at regular intervals.
The AI-Tools do this in the background without you having to do anything yourself. Depending on the type of data, this happens hourly, daily, or weekly.
The performance data is securely stored on the AI-Tools servers at OVH in Limburg and is then available to you directly in the chat. All data is automatically deleted after 370 days. We chose this period so that you can carry out year-over-year comparisons.