

Tools#
You can make tools available to the AI to help it handle your request. For example, it can browse the internet, use a calculator, or create charts.
Selecting tools#
In workflows and assistants, you can choose which tools the AI is allowed to use.

Only use the tools that are necessary for the current task. Too many tools increase token usage and can overwhelm the language model with too much information.
For example, if an uploaded PDF document contains a lot of internet links, the AI might decide to visit them. You can prevent this by disabling the “Browse websites” tool.
With the Automatically detect tools switch, you leave tool selection up to the AI. Here is how it works: a first language model looks at your prompt, decides which tools make sense, and activates them. Then your request is processed with the language model you selected.
If you turn off Automatically detect tools, you have full control over the tools. In that case, the AI will only use the tools you selected manually. It is important to make sure that the tools you want to use are actually enabled.
Tip
Have the AI explain all tools to you
Enable all tools and ask the AI to explain them to you:
“Create a table listing the tools you can use. Describe what each one can be used for.”
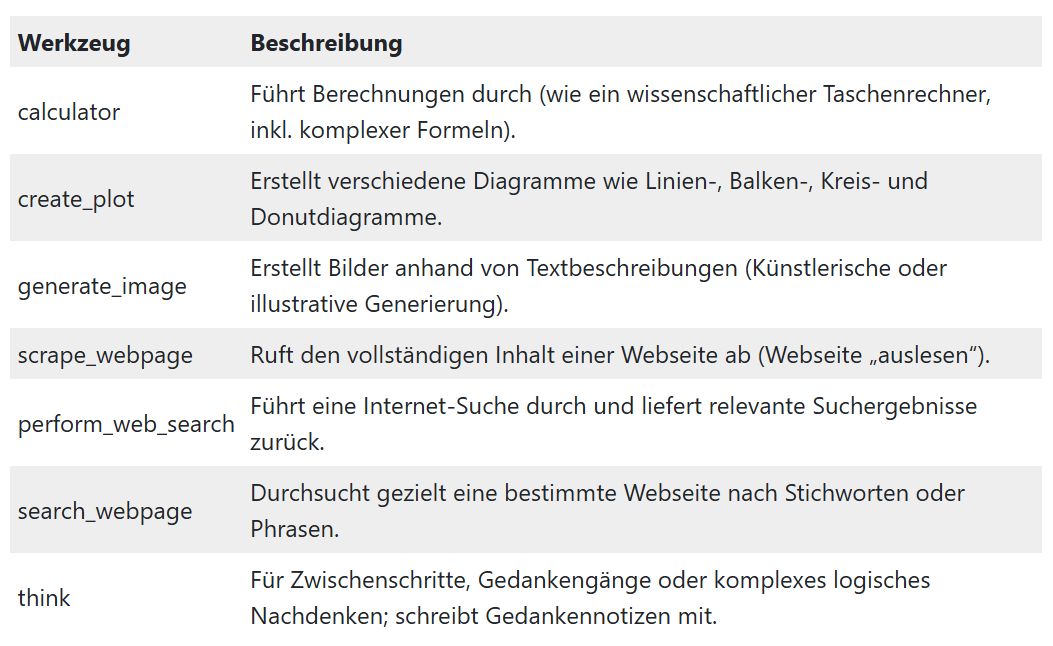
Browse websites#

Use up-to-date information from the internet to solve tasks. Ask the AI to go online.
The language model has access to the web and can open websites. To do this, simply enter the website URL in the prompt. The model will visit the website and use the text it finds there. It cannot interpret images or videos.
Please note that the model can only visit public websites and cannot enter passwords or other private information. It is also possible that the model may not interpret every website correctly. In that case, you can try making the information in your prompt more specific or use a different website.
Also note that large websites can consume a lot of tokens, which increases costs.
Extraction modes#
When visiting a website, you can tell the AI exactly what type of information it should retrieve there. Several extraction modes are available for this purpose. By default, the content mode is used, which is the readable main text of the page.
You do not have to name the modes yourself. It is enough if you describe what you want to know in your prompt - the AI will then select the appropriate mode. However, if you want very precise control, you can also explicitly name the mode.
Mode |
What you get |
Typical use case |
|---|---|---|
|
Cleaned, readable main text of the page |
Reading articles, summarizing, evaluating content |
|
Only the heading structure (H1-H5) as an outline |
Quick overview of a page’s structure |
|
All links on the page including link text, position (navigation, footer, content, etc.), and whether internal/external |
Link lists, source verification, SEO link analysis |
|
Raw HTML of the |
SEO and GEO check, finding missing or duplicate metadata |
|
Complete HTML of the page as the browser sees it after executing JavaScript |
Comparison between a real browser and a simple fetch |
|
Raw HTML/text directly from the server, without JavaScript |
Checking what a simple bot without rendering capabilities sees |
|
Image of the visible area upon loading (without scrolling) |
Showing the AI or yourself what the page looks like |
|
Image of the fully scrolled page |
Visually check the complete page layout |
Note
You can request multiple modes at once. The AI will then retrieve, for example, text and links and a screenshot in a single page visit, instead of accessing the page multiple times.
Reading text and structure#
For most tasks, the default content mode is sufficient. With this, the AI reads the running text of a page just like a human would - without navigation, ads, or menu items.
If you just want a quick overview of a page’s structure, use the headlines mode. This is practical, for example, to check how a competitor’s article is structured without reading the entire text.
“Read the article at [URL] for me and summarize it in five sentences.” |
“Show me only the heading structure of [URL], I want to know how the article is structured.” |
Analyzing links#
The links mode provides you with a complete, deduplicated list of all links on a page - including link text, how often a link appears, where it is located (navigation, footer, content, sidebar), and whether it is internal or external.
This is suitable, for example, for:
a list of external sources from an article
checking which internal pages are linked from the home page
a rough SEO analysis of a page’s link structure
“List all external links on [URL] that appear in the article text.” |
“What internal links are in the footer of [URL], and how often do they appear?” |
SEO and GEO check#
There are three special modes for the technical analysis of a page:
headshows you the raw HTML of the<head>section, i.e., title, meta description, meta tags, and structured data (JSON-LD). This lets you check whether important SEO information is missing, duplicated, or incorrect.renderedshows the page as a real browser sees it after executing JavaScript.rawshows the page exactly as it comes from the server without JavaScript - i.e., what a simple bot without rendering capabilities sees.
The comparison between rendered and raw shows you whether your page relies heavily on JavaScript (client-side rendering) and may therefore appear empty or incomplete to simple crawlers.
Tip
GEO stands for Generative Engine Optimization - i.e., optimizing your content so that AI systems like ChatGPT or Perplexity can read and cite it correctly. The raw mode helps you check whether your most important content is visible even without JavaScript. The AI assistant Sofia SEO does this for you.
In raw mode, you can additionally specify a user_agent to specifically simulate how a particular AI crawler sees the page:
User-Agent |
Simulates |
|---|---|
|
A standard browser (default) |
|
GPTBot by OpenAI |
|
ClaudeBot by Anthropic |
|
Perplexity’s crawler |
This is helpful, for example, to check whether a firewall or bot protection (WAF) blocks certain AI crawlers while normal browsers can view the page without issues.
“Check the |
“Compare the rendered and raw content of [URL]. Is important text missing in raw mode?” |
“Fetch [URL] once with the gptbot user-agent and once normally. Are there any differences?” |
Note
The rendered and raw modes return a great deal of, and partially unprocessed, text, thereby consuming more tokens. Request them only if you really need this technical level of detail.
Creating screenshots#
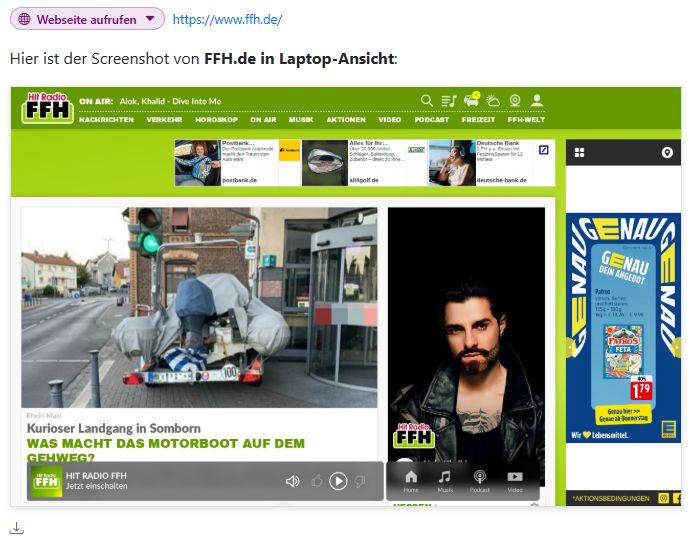
With the screenshot and full_screenshot modes, you can have a website displayed as an image instead of reading it as text. screenshot shows only the visible area upon loading (i.e., what a visitor sees without scrolling), while full_screenshot shows the complete, scrolled page.
Using device, you can specify which device is used to “view” the page:
Device |
Resolution |
When useful |
|---|---|---|
|
1920×1080 (default) |
Sufficient for almost all tasks |
|
1280×800 |
Smaller desktop view |
|
iPad size |
Responsive check for medium screens |
|
iPhone size |
Check mobile view, e.g., for mobile-first indexing |
If you need a very specific screen size, you can specify a custom_viewport with custom width and height in pixels instead of device.
With above_the_fold, you only get the area that a visitor sees directly when opening the page, without scrolling. This is useful for checking what is perceived at first glance - for example, on a landing page or a stream player.
“Take a screenshot of [URL] in mobile view.” |
“Show me a full screenshot of the entire page [URL], not just the top area.” |
“What does [URL] look like on a tablet? What can be seen without scrolling?” |
Slow or dynamic pages#
Some websites load their content with a delay, for example via JavaScript. If the page content appears incomplete or something that should be there is missing, you can ask the AI to wait a bit longer before reading the content using scrape_with_delay.
Tip
Use this option only when really necessary. Normally, the regular fetch is sufficient, and waiting consumes additional time.
“The content of [URL] seems incomplete, the page appears to load dynamically. Wait a moment and try again.” |
Retrieving multiple pieces of information in one step#
You do not need to request a new page visit for each piece of information. The AI can retrieve multiple modes simultaneously for the same page, for example text, links, and a screenshot in a single step.
“Visit [URL], summarize the content, list all external links, and additionally take a screenshot.” |
This saves time and tokens because the page is loaded only once instead of again for each piece of information.
Targeted extraction with the web scrape agent#
For large websites with a lot of content, it is worthwhile not to bring the entire page into the chat, but instead to extract specifically only what you really need. The web scrape agent is available for this purpose.
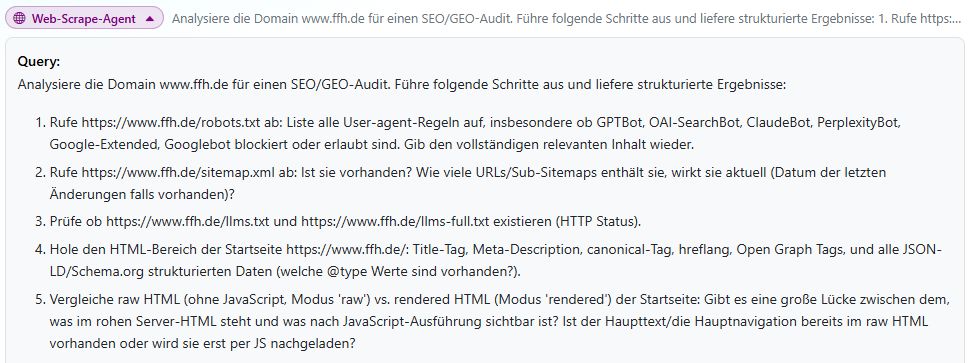
The web scrape agent is an independent, cost-effective helper to which you describe a task. It visits the specified page (or multiple pages) itself, searches for the desired information, and returns only the result to you - not the entire page content.
How the agent works#
A simple principle is behind this in the background: The language model in your chat assumes the role of an orchestrator. It commissions the web scrape agent with a clearly defined task, for example, “Get me the current broadcast times from this page.”
The agent itself runs on a small, very fast, and inexpensive AI model. It takes care of three steps:
It calls the web scraper and visits the specified page or pages.
It searches the page content and extracts precisely the information you requested.
It summarizes the result and sends only this summary back to the language model in your chat.
For you as a user, this remains in the background. You only notice that the answer comes faster and the conversation is not cluttered with unnecessary page content.
Note
You can also ask the AI directly in the chat to use the web scrape agent for complex web research. This is especially worthwhile if you want to search multiple pages or need only a small excerpt from a very long page.
Why this saves tokens and costs#
If you were to load a very long website completely into the chat, the main language model would have to read and process the entire text - including the parts you are not interested in. This costs tokens, meaning computing power, and thus money and time.
The web scrape agent instead performs this preliminary work with a much cheaper and faster model. Only the compact final result ends up in the chat and is further processed by the main model.
Tip
For a single, short page, the agent is usually not worthwhile. Its advantage shows primarily with long pages, multiple pages at once, or recurring queries such as weather or program data.
When use is worthwhile#
Using the agent is particularly sensible when:
the page is very long or rich in content
you only need a small excerpt of the information (e.g., only headings or only prices)
you want to have multiple pages searched in one go
Tip
Describe to the web scrape agent as precisely as possible which URL(s) it should visit and what information you expect. The more concrete the assignment, the more precise the result.
Example requests#
“Get the 10 latest headlines from tagesschau.de.” |
“Visit the weather page [URL] and give me only the temperature and rain probability for today.” |
“Check the program page on [URL] and list only today’s broadcast times for me.” |
“Compare the homepages of [URL1] and [URL2] and tell me which top story is in the first position in each case.” |
“Use the web scrape agent to search [URL] and tell me only the prices of the offers.” |
Note
The web scrape agent is particularly suitable for clearly defined extraction tasks. For reading and understanding a single article, a normal page visit with content mode is usually completely sufficient.
When to use which tool?#
Task |
Recommendation |
Why |
|---|---|---|
Reading or summarizing articles |
Normal page visit, content mode |
Simplest and cheapest way |
Overview of page structure |
headlines mode |
Fast, without loading the full text |
Listing links or sources |
links mode |
Provides the position and type of each link directly |
SEO/GEO check of a page |
head, rendered, raw modes |
Shows technical differences and missing metadata |
Visual check of a page |
screenshot / full_screenshot modes |
Shows the layout, no image interpretation needed |
Targeted info from large/multiple pages |
Web scrape agent |
Saves tokens, returns only the result instead of the whole page |
If you are unsure which tool fits: simply describe to the AI in normal language what you want to know. It will generally select the appropriate mode itself or fall back to the web scrape agent if that makes more sense.
Searching the internet#
The AI-Tools are a powerful research tool, giving you several ways to find information on the internet. You can use the search tools individually or combine them for in-depth research.
The search tools include Google AI Search, Perplexity, GPT Search, and Anthropic Search, for example.
Google AI Search: Uses Google’s large search index. If you use one of the Gemini language models, this search is preferred.
You can also explicitly request Google AI Search in the prompt and use it with other language models. To do this, write “Use Google AI Search to find information about …” or “Ask Google about …” in your prompt.
Note: Google AI Search requires your own Google account. Alternatively, you can use token credit if your organization does not have its own account.
GPT Search: This is OpenAI’s search engine. You can use GPT Search with all language models in the AI-Tools.
Perplexity: A language model and search engine in one. Perplexity cannot use any tools other than search, but it delivers very good results. Perplexity is available in the AI-Tools as a standalone language model.
Anthropic Search: This is the search engine from Anthropic, the maker of Claude. You can use Anthropic Search with all language models in the AI-Tools.
Google Maps#
Your local research just got even easier. Whether you are researching potential advertising clients, looking for event venues, or trying to find experts for your feature, the AI searches Google Maps for you and delivers all relevant information at once:
Comprehensive location lists with all relevant businesses and venues
Direct links to Google Maps for every location found
Ratings and reviews for quick quality assessment
Opening hours - so you know when you can call
Contact information and additional details
Geographic filtering by radius or city area
Important to know: Route planning is not possible. The tool focuses on research and information gathering.
Start your prompt with:
“Ask Google Maps for …” or “Use Google Maps to find …”
The AI automatically recognizes that you want to use the Google Maps tool, performs the search, and prepares the results clearly for you. Try the prompts from the following real-world examples:
Sales#
Prospecting for industry campaigns
Ask Google Maps for all car dealerships within a 50 km radius of Kassel.
Create a list with names, ratings, and contact details.
Restaurant advertising
Use Google Maps to find all restaurants in downtown Hamburg with
at least 4 stars. I need an overview for our restaurant campaign.
Local retailers
Ask Google Maps for fashion stores in Münster. Show me ratings,
opening hours, and Google Maps links for prospecting.
Specialized service providers
Use Google Maps to find all gyms in the Stuttgart area. I need
a list with ratings for our fitness advertising campaign.
Editorial#
Expert research
Ask Google Maps for pediatricians in Freiburg with good ratings.
We are preparing a feature on pediatric medicine.
Location scouting for features
Use Google Maps to find unusual cafés and cultural venues in Leipzig-
Plagwitz for our neighborhood feature.
Event coverage
Ask Google Maps for event venues and event locations in Bremen.
We are planning a series on the local event scene.
Finding interview partners
Ask Google Maps for employment lawyers in Frankfurt.
We are looking for experts for an interview on labor law reform.
Marketing & Events#
Venue search
Use Google Maps to find suitable event venues for 500-1000 people
in the Hanover area. Show me ratings and contact details.
Catering research
Ask Google Maps for catering services in Nuremberg with at least
4.5 stars for our radio festival.
Hotel accommodation
Use Google Maps to find hotels near Munich Airport for our
international artists. Show ratings and price categories.
Technical service providers
Ask Google Maps for event technology companies and live sound
service providers in Dresden for our open-air event.
Infrastructure check
Use Google Maps to find large parking lots and parking garages within
2 km of [event venue] for our visitor planning.
Tips for the best results#
Be precise: The more accurately you specify your search radius and category, the more relevant the results will be.
Use filters: Ratings, opening hours, or specific attributes can be requested directly in the prompt.
Combine requests: You can combine several searches in one prompt, for example “Hotels AND restaurants near …”.
Further processing: Ask the AI to prepare the results directly as a table, list, or Excel file.
Geographic details: Use city names, postal codes, or radius-based details (for example, “within a 30 km radius of …”).
Advanced queries#
You can also have the results processed further right away:
Ask Google Maps for all bakeries in Heidelberg. Create an Excel
spreadsheet for me with name, address, rating, opening hours, and
Google Maps link, sorted by rating.
The AI will not only perform the search, but also create the Excel file you want - ready for your next steps.
Note: Google Maps requires your own Google account. Alternatively, you can use token credit if your organization does not have its own account.
DPA Archive#
With the DPA Archive tool, you get direct access to the extensive archive of Deutsche Presse-Agentur - one of the most reliable sources of verified news information in the German-speaking world. Perfect for quick research, fact-checking, and enriching your articles with verified information.
How it works#
Simply start your search with the command “Ask the DPA Archive about …” in your prompt. A specialized AI agent searches the DPA Archive for you and provides:
A concise summary of all results found
A list of links to the original DPA articles for reading and citing
You can process the results further right away, combine them, or use them as the basis for your own texts.
Real-world use cases#
Quick fact-checking
Need to verify a piece of information? Ask directly:
Ask the DPA Archive for the current population of Berlin
and when this figure was last updated.
Or:
Ask the DPA Archive for the exact date of the last
federal election and the official final result.
Background research for articles
Quickly gather background information for your article:
Ask the DPA Archive for the most important events related to
"Germany's energy transition" over the last 6 months. Create
a chronological summary for me including dates.
Finding quotes
Ask the DPA Archive for quotes by Chancellor Merz
on climate policy from the last 3 months. Create a
list with quote, date, and context.
Topic research for features
Ask the DPA Archive for reports on the shortage of skilled workers
in healthcare. Summarize the most important figures, facts, and
developments.
Creating a chronology
Especially useful for background pieces:
Ask the DPA Archive for all important developments in the case of
the Ahr Valley flood since 2021. Create a timeline with the
most important events and decisions.
Creating a Q&A article
Ask the DPA Archive for information on the EU AI Act.
Use it to create a Q&A article with 8 important questions and
answers for our readers.
Research on people and companies
For sales and event departments:
Ask the DPA Archive for current reports on the company
Siemens Energy from the last 12 months. Create a summary
of the most important developments and strategic decisions.
Comparative analyses
Ask the DPA Archive for coverage of electric mobility
in 2024 and 2025. How have the main topic areas changed?
Create a comparative analysis.
Regional research
Especially useful for local editorial teams:
Ask the DPA Archive for all reports about Hamburg from the
last 14 days. Filter them by politics, business, and culture.
Using it in AI workflows#
The DPA Archive can also be integrated into automated workflows. This allows you to build multi-step research and writing processes in which the AI first searches the DPA Archive, analyzes the results, and then creates a finished article - fully automated!
Tips for better results#
Be specific: The more precise your search query, the more relevant the results
Specify time periods: “in the last 3 months”, “since 2023”, “in the last week”
Combine with tasks: Have the information found summarized, structured, or converted into other formats right away
Source references: The links to the original DPA reports make it possible to cite correctly and verify the information
Note: Access to the DPA Archive requires an appropriate subscription with Deutsche Presse-Agentur.
RSS feed#
What is it?
Many websites also provide their latest updates in a machine-readable format known as an RSS feed or XML feed. The format is also common for podcasts, where it is used to inform podcast apps about the latest episodes.
Some fields in the feed are predefined. For example:
title: the title of the item
description: short summary
pubDate: publication date and time
Why is this useful?
When the AI retrieves a feed, it can have the feed filtered. For example: Retrieve the 10 most recent items from the last 10 hours. The feed reader in the AI-Tools then reads the entire feed with all items, but only passes on the items that match the criterion to the AI. This means the language model only receives relevant information.
What are the benefits?
Retrieving a feed is much faster than reading an entire webpage, and it uses significantly fewer tokens. Depending on the task, token usage and processing time are reduced by a factor of 2 to 3.
Tip
Try this prompt:
Retrieve the two latest items from the Tagesschau RSS feed. Display the items with images like in a newspaper, including the publication time.

The RSS feed function is part of the Browse websites tool.
Calculator#
Language models are not very good at calculations. But they can use the calculator. The AI-Tools include a very powerful scientific calculator.
The calculator is more than just a calculation tool: besides classic math functions, it also supports business KPIs such as ROI, forecasts, ABC analysis, and clustering. This lets you analyze data directly in the chat - without opening Excel.
Basic functions#
Arccosine, hyperbolic arccosine, arcsine, hyperbolic arcsine, arctangent, two-argument arctangent, hyperbolic arctangent, rounding up, cosine, hyperbolic cosine, degrees, distance, Euler’s number, exponential function, rounding down, gamma function, hypotenuse, logarithm, base-10 logarithm, integer and fractional part, pi (π), power, product, radians, remainder, sine, hyperbolic sine, square root, sum, tangent, hyperbolic tangent, roots, rounding, absolute value, minimum, maximum.
Date, time, calendar calculations, time differences, weekday, month name, year number, leap year, calendar week.
Text and reading time#
Count the words and characters in a text and determine the estimated reading time based on a speaking speed in words per minute (WPM).
Process and convert texts, find and count specific words in the text. Regular expressions (regex) can be used to recognize and extract complex text patterns.
Calculate business KPIs#
With the following functions, you can calculate business KPIs, classify data, and create forecasts directly in the chat. This is especially useful for quick analysis in sales, marketing, finance, HR, and editorial work.
Percentages and changes#
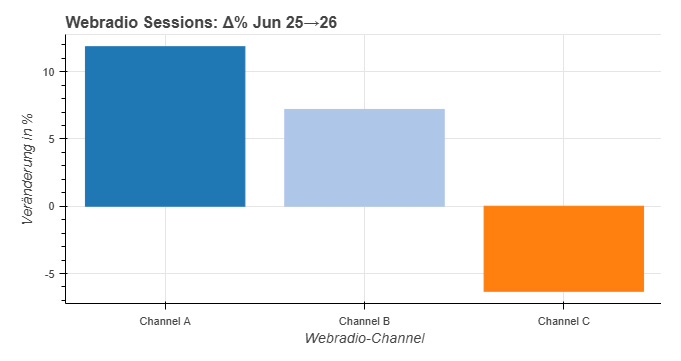
Use pct_change to calculate the percentage change between two values - for example, the year-over-year comparison of web radio sessions or website reach.
Use pct_of to calculate the percentage share of a value in relation to the total - for example, a campaign’s share of annual revenue within the total budget.
Tip
Example: Year-over-year comparison of web radio sessions
Calculate the percentage change in web radio sessions from June 2025 to June 2026 for the following web radios. Channel A: 1,240,000 → 1,387,000. Channel B: 890,000 → 954,000. Channel C: 760,000 → 712,000. Show the result as a bar chart.
Rankings#
Use rank to sort a list of values into a ranking - for example, the most-listened-to web radio channels, the best-performing articles of the week, or the highest-revenue advertising clients.
ABC analysis#
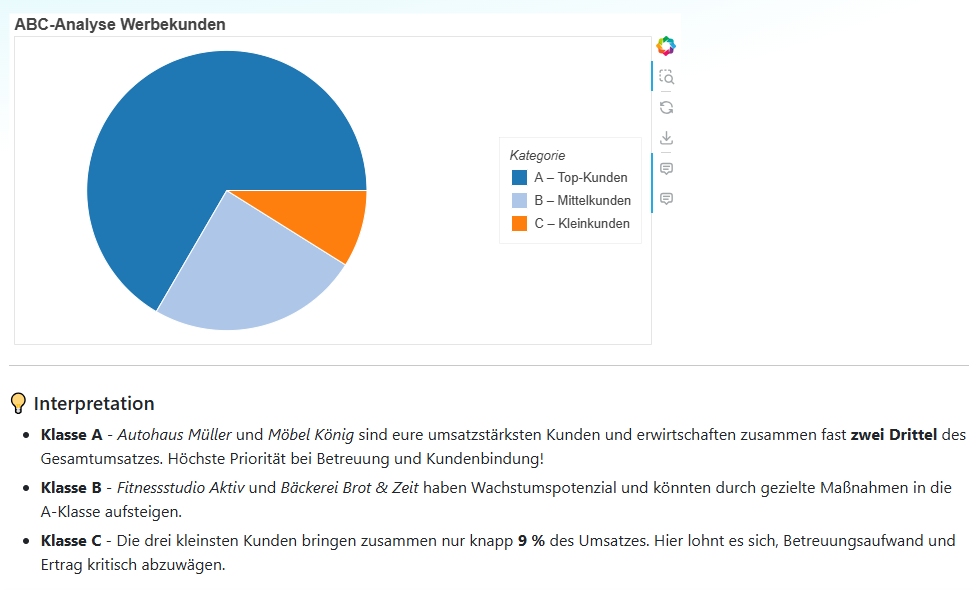
Use abc_classification to classify a list of items into categories A, B, and C based on the Pareto principle:
A - Top items with the largest share of the total value (approx. 80%)
B - Mid-tier items (approx. 15%)
C - Smaller items (approx. 5%)
This is especially useful in sales and finance for prioritizing clients, products, or campaigns based on their contribution to total revenue.
Tip
Example: Classifying advertising clients by revenue
Run an ABC analysis for the following advertising clients and show the result as a pie chart with the three categories A, B, and C. Clients and annual revenue in euros: Autohaus Müller 48,000, Möbel König 35,000, Fitnessstudio Aktiv 22,000, Bäckerei Brot & Zeit 8,500, Reisebüro Fernweh 6,200, Blumenhandel Rosengarten 3,100, Kiosk Stadtblick 1,800.
Calculate ROI#
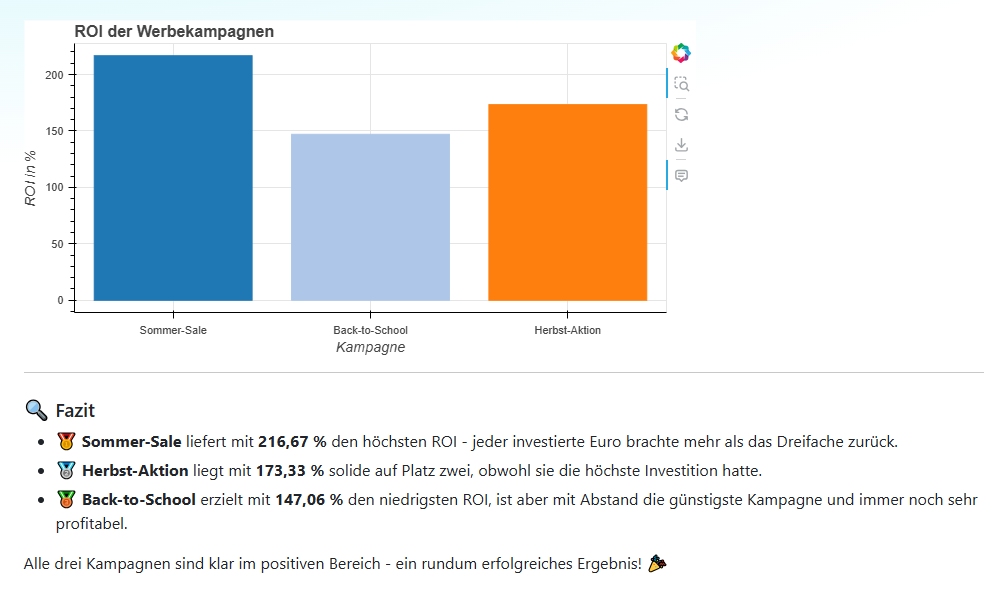
Use roi to calculate the return on investment of an activity. Input: investment and return. Output: ROI as a percentage.
Use cases: campaign ROI, event profitability, comparison of advertising measures.
Tip
Example: Comparing campaign ROI
Calculate the ROI of the following advertising campaigns and show the result as a bar chart. Summer Sale campaign: investment €12,000, return €38,000. Back-to-School campaign: investment €8,500, return €21,000. Autumn Promotion campaign: investment €15,000, return €41,000.
Correlation matrix#
The function checks whether two or more metrics are statistically correlated - i.e., whether they move up or down together.
What you can use this to check:
Advertising budget vs. streaming revenue: Shows whether media investments translate into listening duration.
Newsletter open rate vs. click-through rate: Checks whether strong subject lines also lead to more website traffic.
Broadcast time reach across multiple stations: For station groups, this makes it easy to see whether a trend affects all stations or is only local.
Forecasts#
Use linear_forecast to create a linear forecast based on historical data. You provide a time series and define how many future periods the AI should project.
Use cases: forecasting web radio sessions, revenue development, and audience reach trends.
Non-linear forecasts#
Not every metric develops in a straight line. Some values accelerate, others flatten out or follow an S-curve. For such cases, you use trend_forecast_poly instead of linear_forecast.
The function fits a polynomial trend line through your historical values and projects it for the desired number of future periods. The values must be present at regular intervals, for example as daily, weekly, or monthly metrics.
Use cases: campaign reach that accelerates, seasonal listener curves, or the growing usage of a newly introduced feature.
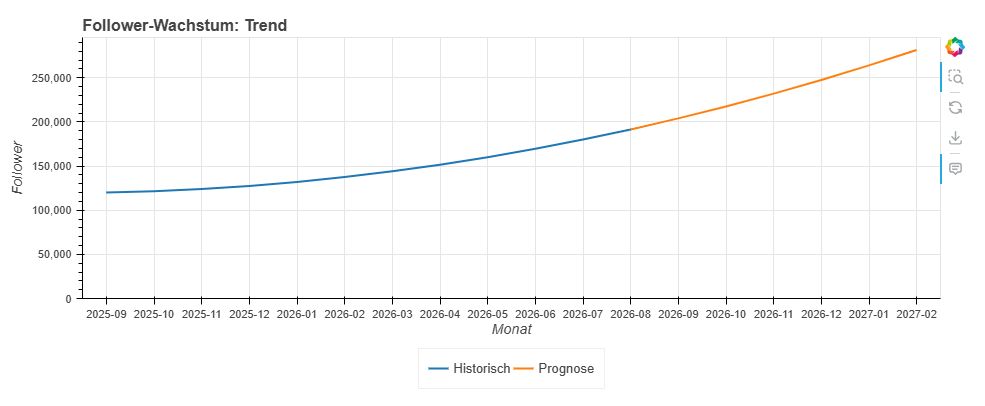
In this example, we took the follower growth of the past 12 months and created a forecast for the next half year. The trend line shows that the 200,000 mark is expected to be broken in September.
Parameters |
Description |
Default |
|---|---|---|
|
List of historical, evenly spaced measured values. |
|
|
Degree of the polynomial function. 1 corresponds to a linear forecast, 2 represents acceleration or deceleration, 3 can also capture turning points. |
2 |
|
Number of future periods to be calculated. |
3 |
|
Number of decimal places in the returned values. |
2 |
The function returns more than just the forecast values:
Return value |
Meaning |
|---|---|
|
List of calculated forecast values for the specified periods. |
|
The polynomial degree actually used. |
|
Goodness of fit for the historical data. 1.0 means a perfect fit, values well below 0.5 mean the forecast is not trustworthy. |
|
True if the calculation was numerically unstable, for example because the selected polynomial degree is too high for the available amount of data. In this case, you should use the forecast with caution. |
Tip
Choose the polynomial degree to match the shape of your data: degree=1 for a steady trend, degree=2 for noticeable acceleration or deceleration, degree=3 only if you expect a clear turning point in the data. Higher degrees tend to overfit quickly - use them only if there are enough historical data points.
Note
After each forecast, check the value of r_squared and the ill_conditioned_fit flag. A low r_squared value or an ill_conditioned_fit of True indicate that the model does not fit your data well.
Example: trend_forecast_poly([100, 108, 130, 168, 220], degree=2, periods_ahead=2) returns a forecast of 284.29 and 362.86 for the two subsequent periods, with an r_squared of 0.9987 and an ill_conditioned_fit of False.
Weighted scoring#
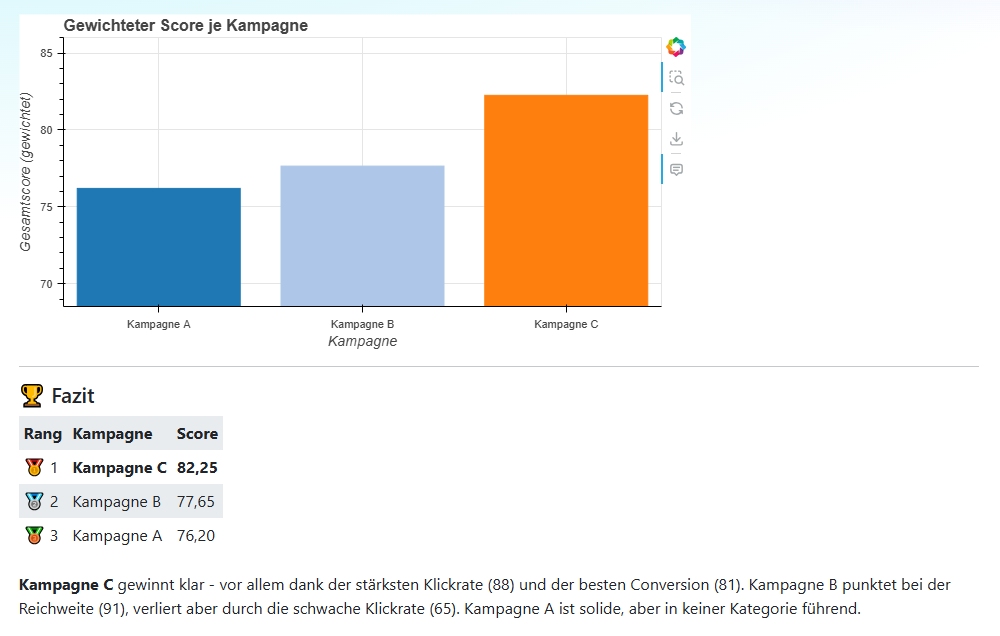
Use weighted_score to calculate a weighted overall score from multiple individual values with different weightings. This is ideal when you want to evaluate and compare options based on several criteria.
Use cases: evaluating campaigns by reach, click-through rate, and conversion; supplier evaluation in procurement; candidate evaluation in HR processes.
Tip
Example: Evaluating campaigns based on multiple KPIs
Evaluate the following three campaigns using a weighted score. Criteria and weighting: reach 40%, click-through rate 35%, conversion 25%. Campaign A: 85, 72, 68. Campaign B: 91, 65, 74. Campaign C: 78, 88, 81. Show the overall score of each campaign as a bar chart.
Clustering and classification#
Use kmeans_clustering to automatically group data points into clusters. The AI detects patterns in the data and divides them into k groups - without you having to define the groups in advance.
kmeans: You have unlabeled data and want to discover groups.
Use cases: listener segmentation based on usage behavior, customer segmentation for sales campaigns, analysis of usage patterns.
Tip
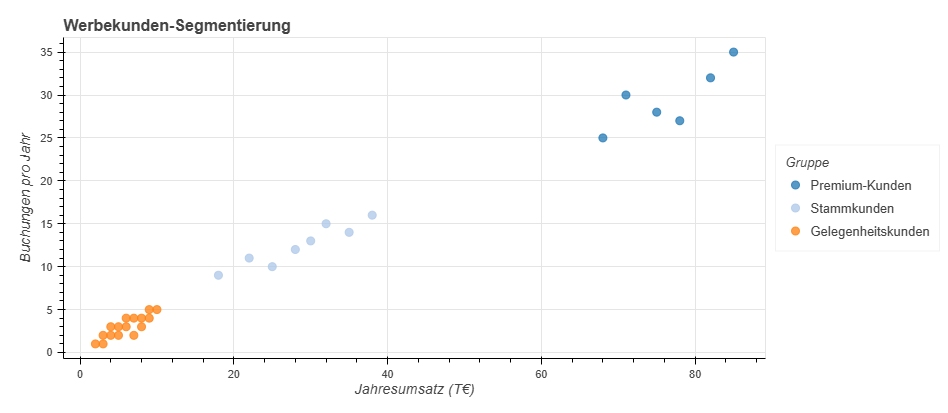
Example: Advertising client segmentation with a scatter plot
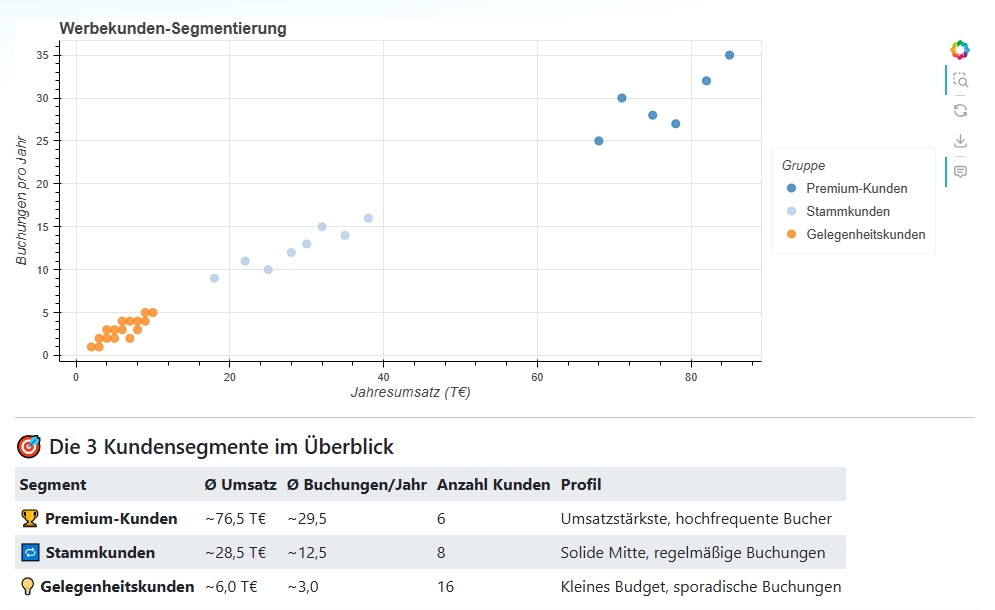
Segment the following advertising clients of our station into 3 clusters based on annual revenue (in thousand euros) and number of bookings per year. Give the clusters meaningful names, such as “Premium Clients,” “Regular Clients,” and “Occasional Clients,” and show the result as a scatter plot. Data (revenue in thousand euros, bookings per year): [75, 28], [82, 32], [68, 25], [71, 30], [85, 35], [78, 27], [28, 12], [32, 15], [25, 10], [22, 11], [35, 14], [30, 13], [18, 9], [38, 16], [5, 3], [8, 4], [3, 2], [6, 3], [9, 5], [4, 2], [7, 4], [2, 1], [10, 5], [5, 2], [6, 4], [3, 1], [8, 3], [4, 3], [7, 2], [9, 4].
Use knn_classify to automatically assign new data points to a segment based on their similarity to known examples (K-nearest neighbor method). This is useful for assigning new leads or listeners to an existing segment - without manual classification.
knn: You have labeled historical data and want to classify a new case.
Tip
Example: Lead qualification for a new advertising client
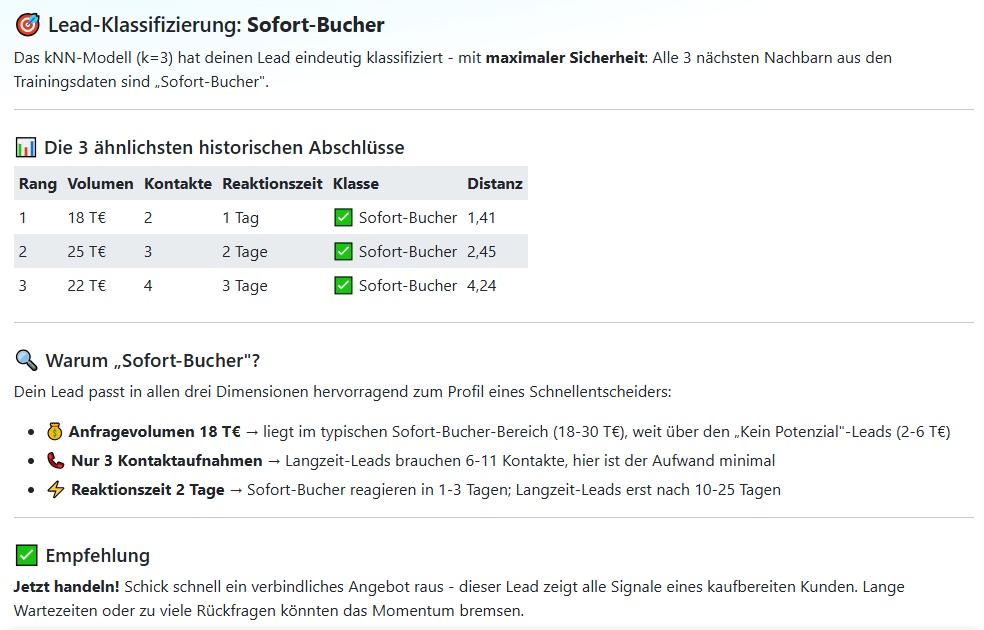
I have a new advertising client lead: inquiry volume €18k, 3 contacts so far, response time to our proposals 2 days. Based on the following historical closed deals, classify this lead as “Immediate Booker,” “Long-Term Lead,” or “No Potential”:
Training data (inquiry volume in €k | contacts | response time in days | outcome): [20, 2, 1, “Immediate Booker”], [25, 3, 2, “Immediate Booker”], [18, 2, 1, “Immediate Booker”], [22, 4, 3, “Immediate Booker”], [30, 3, 2, “Immediate Booker”], [28, 2, 1, “Immediate Booker”], [15, 8, 14, “Long-Term Lead”], [12, 10, 21, “Long-Term Lead”], [18, 7, 10, “Long-Term Lead”], [20, 9, 18, “Long-Term Lead”], [10, 6, 12, “Long-Term Lead”], [14, 11, 25, “Long-Term Lead”], [5, 2, 30, “No Potential”], [3, 1, 45, “No Potential”], [4, 3, 28, “No Potential”], [2, 1, 60, “No Potential”], [6, 2, 35, “No Potential”], [3, 2, 50, “No Potential”].
Limits of the calculator#
Note
The calculator is optimized for fast calculations in the chat - not for processing large datasets.
For many everyday tasks in sales, marketing, and editorial work, however, just a few data points are enough to get meaningful results quickly in the chat.
Generate charts#
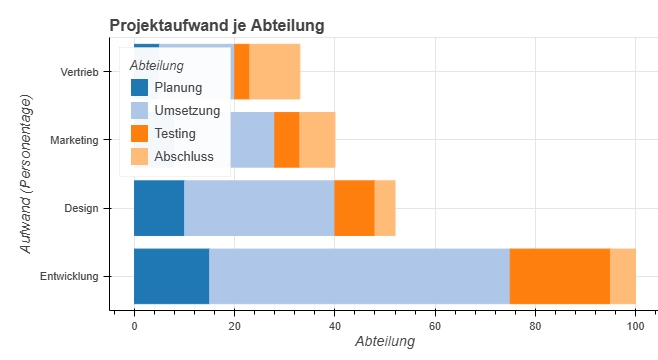
With the Generate charts tool, you enable the AI to create charts. The following chart types are currently available: line chart, bar chart, pie chart, donut chart, scatter plot, and effort-impact matrix.
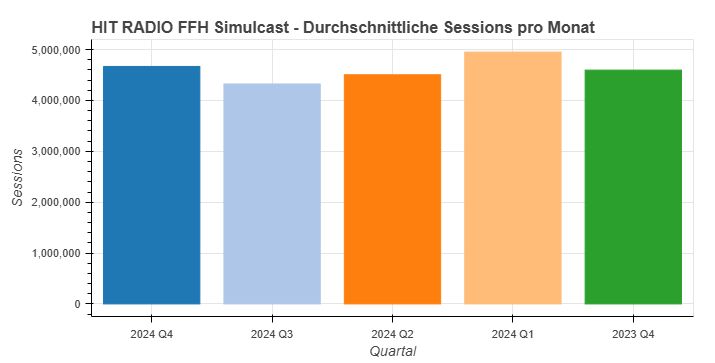
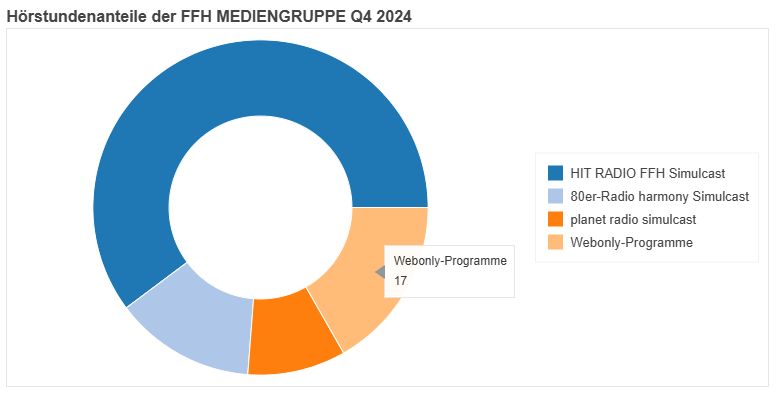
You can also use multiple tools. The language model calculated the percentages for the following donut chart using the calculator.
The scatter plot shows the distribution of data points in a two-dimensional coordinate system. It is ideal for making relationships between two variables visible or identifying clusters in data.
Use cases: listener segmentation, the relationship between advertising spend and reach, and visualization of clustering results from the calculator’s kmeans_clustering function.
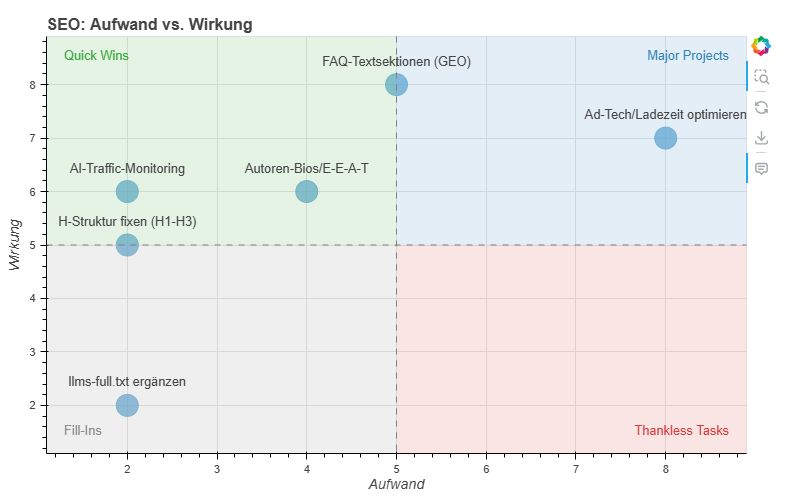
In many projects, there are measures that require high effort but have little impact. Or the low-hanging fruits that achieve a large impact with little effort. The effort-impact matrix helps you identify and prioritize these measures. It shows at a glance which measures bring the greatest benefit and which are rather ineffective.
Tip
What you can do with it:
Analyze Excel spreadsheets and visualize KPIs.
Display statistics from a table in a chart.
Retrieve data from a website and display it as a chart.
Compare multiple data series in a line chart.
Use a scatter plot to make clusters and patterns in data visible.
Create reports and send them as PDFs.
Thought memory#
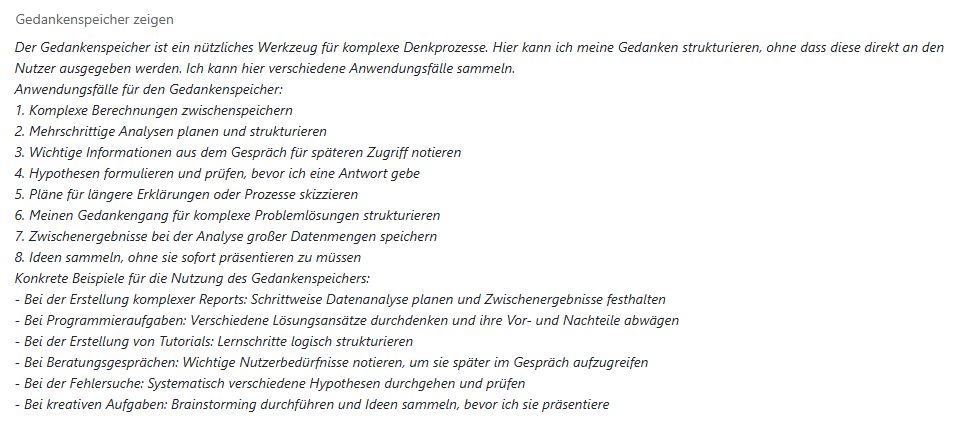
This tool is a real performance booster. It gives the AI a kind of notebook where it can write down information, thoughts, and plans without including them in the output. This is especially helpful for more complex tasks such as retrieving data, analyzing it, creating charts, evaluating results, making recommendations, and turning everything into a report.
Here, we asked Claude to write into the thought memory what it would like to use the function for. You can view the contents of the thought memory by clicking the “Show thought memory” link.
Tip
Always enable thought memory.
This makes models with reasoning capabilities especially even more powerful, such as GPT-5.2 or Claude 4.6 Sonnet.
Generate images#
You can have the AI generate images with the FLUX, Gemini, and GPT Image image generators. If you do not specify otherwise, the image will be created with the FLUX generator.
You can also specify in the prompt that the image should be generated with GPT Image or Gemini. You can also say whether you want the image in portrait, landscape, or square format.
In prompts and assistants, you can use these image generators: Gemini (Nano Banana), GPT Image, FLUX, and FLUX Small.
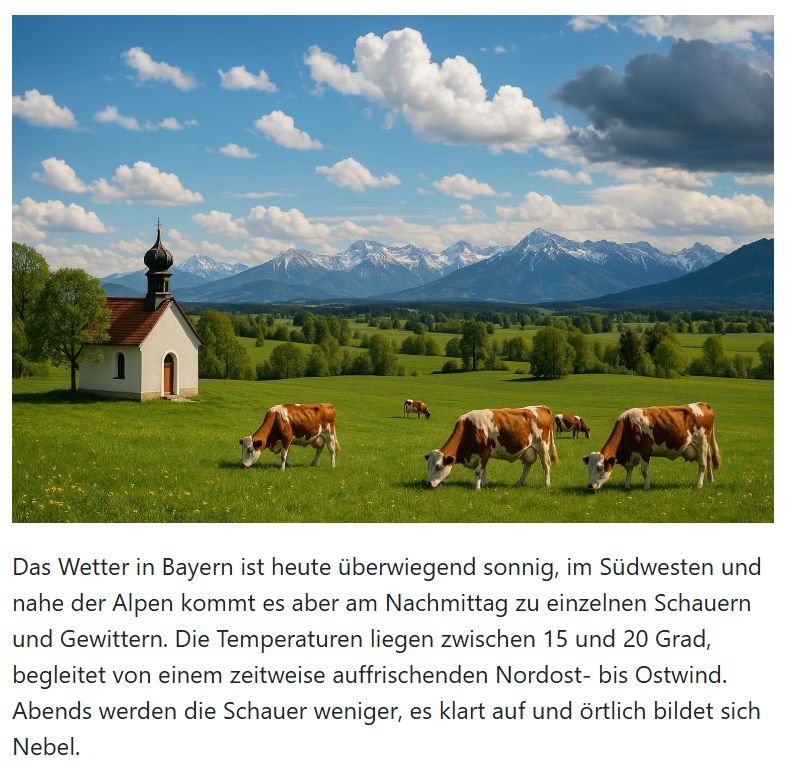
Example: “Retrieve the weather report for Bavaria and summarize it in three sentences. Generate an image that matches the weather and Bavaria and display it above the weather report.”
Transcribe#
With this tool, the AI can convert audio files into text.
In most cases, you will transcribe audio files directly by opening them in the Transcription section and clicking the transcription button there.
If you drag and drop audio files into the browser or open them with the Select files button, they will not be transcribed. If the AI still needs the transcript, it can use the Transcribe tool.
Create files#
You can ask the language model to write the output directly into a file that you can download. The AI-Tools can create the following file types: Word (docx), PDF (pdf), Excel (xlsx), and CSV (csv).
In addition, it can create plain text files with these extensions: bat, c, conf, config, cpp, css, dockerfile, env, h, html, ini, java, js, json, log, md, php, pl, properties, ps1, py, rb, service, sh, sql, swift, toml, ts, txt, xml, yml.
Tip
Try this prompt:
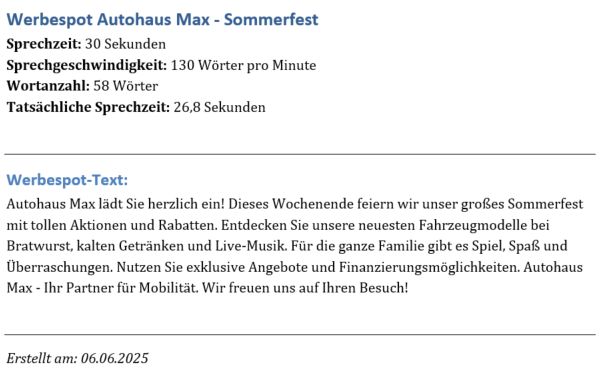
Write an advertising spot for Autohaus Max, which is celebrating its summer festival this weekend. The spot should be 30 seconds long. Speaking speed: 130 words per minute. Write the finished text into a Word file.

Programming websites#
Websites are nothing more than text files with the .html extension. The AI-Tools can create websites for you by generating the HTML code.
Tip
Try this prompt:
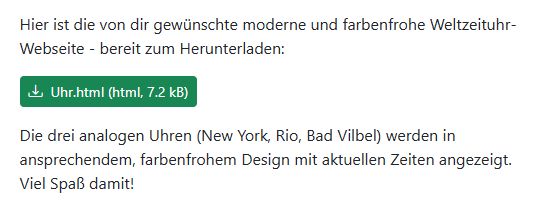
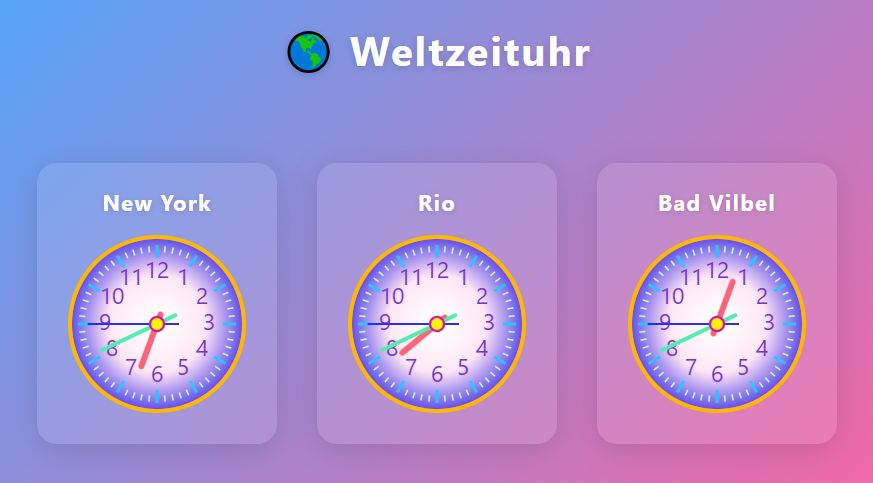
You are a web developer known for your modern and colorful layouts. Create the webpage for a world clock. The page should display three clocks with analog dials: New York, Rio, Bad Vilbel. Write the complete code into the file “clock.html” for download.
Choose a powerful model for generation, such as GPT-4.1.
AI voices#
The AI-Tools can convert text into speech using various AI voices. You can use voices from Microsoft, ElevenLabs, and Google.
The AI voices can be used for a variety of tasks, such as podcasts, audio dramas, or reading out weather reports, news, and traffic updates.
You can also use the voices for advertising spots, jingles, or other audio content, and have the voices automatically mixed with music. And all of that works simply by prompt. You tell the AI what to do, and it generates the voices and mixes them with music.
Here is an example prompt:
Retrieve the weather for our area in Hesse and write it in about 40 words in a radio-presenter style. Produce the text with a male AI voice.
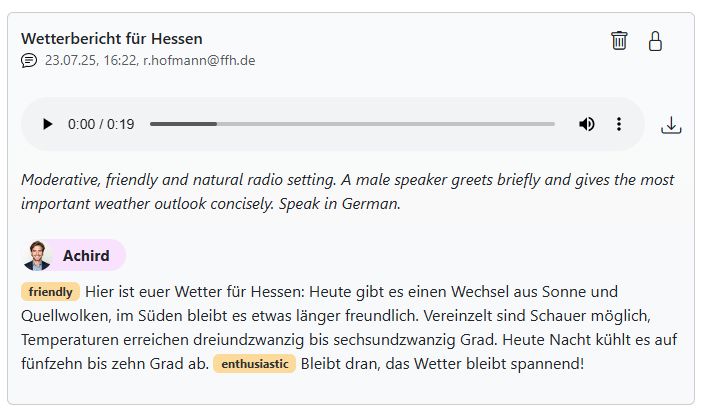
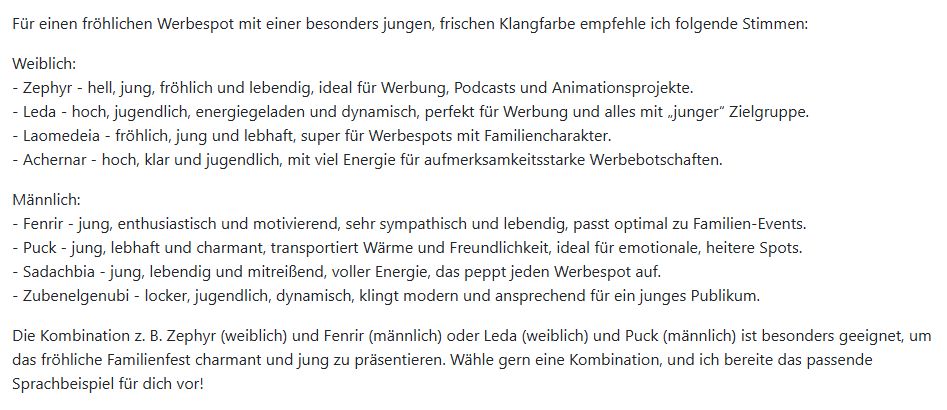
You can also ask for voice recommendations for a specific use case. Try this prompt:
I want to produce an advertising spot for a cheerful family festival and I am looking for one female and one male voice. Which ones sound especially young?
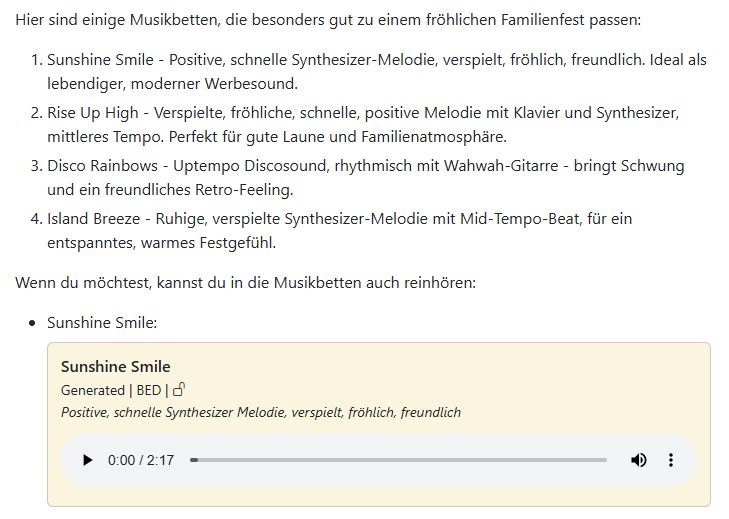
Then ask for a suitable music bed as well:
And which music beds would you recommend for that?
Here is another prompt idea for AI voices:
Tip
Have extensive information on a topic produced as a podcast
Visit the following website and turn the information into an informative dialogue with two AI voices in a relaxed podcast style: https://www.radio-creator.com/content.html
Voice Changer#

You can change any voice with the Voice Changer. Your voice controls the AI voice, giving you full control over timing, emphasis, and emotions.
You can find the Voice Changer in the AI voices module.
However, you can also use the Voice Changer as a standalone tool in prompts.
Tip
Try out the Voice Changer:
Use the voice recording function to record a text in your own voice. Speak loudly and clearly.
Ask the AI to change your voice. For example:
Change my voice so that it sounds like the voice of a news presenter.
Audio production#
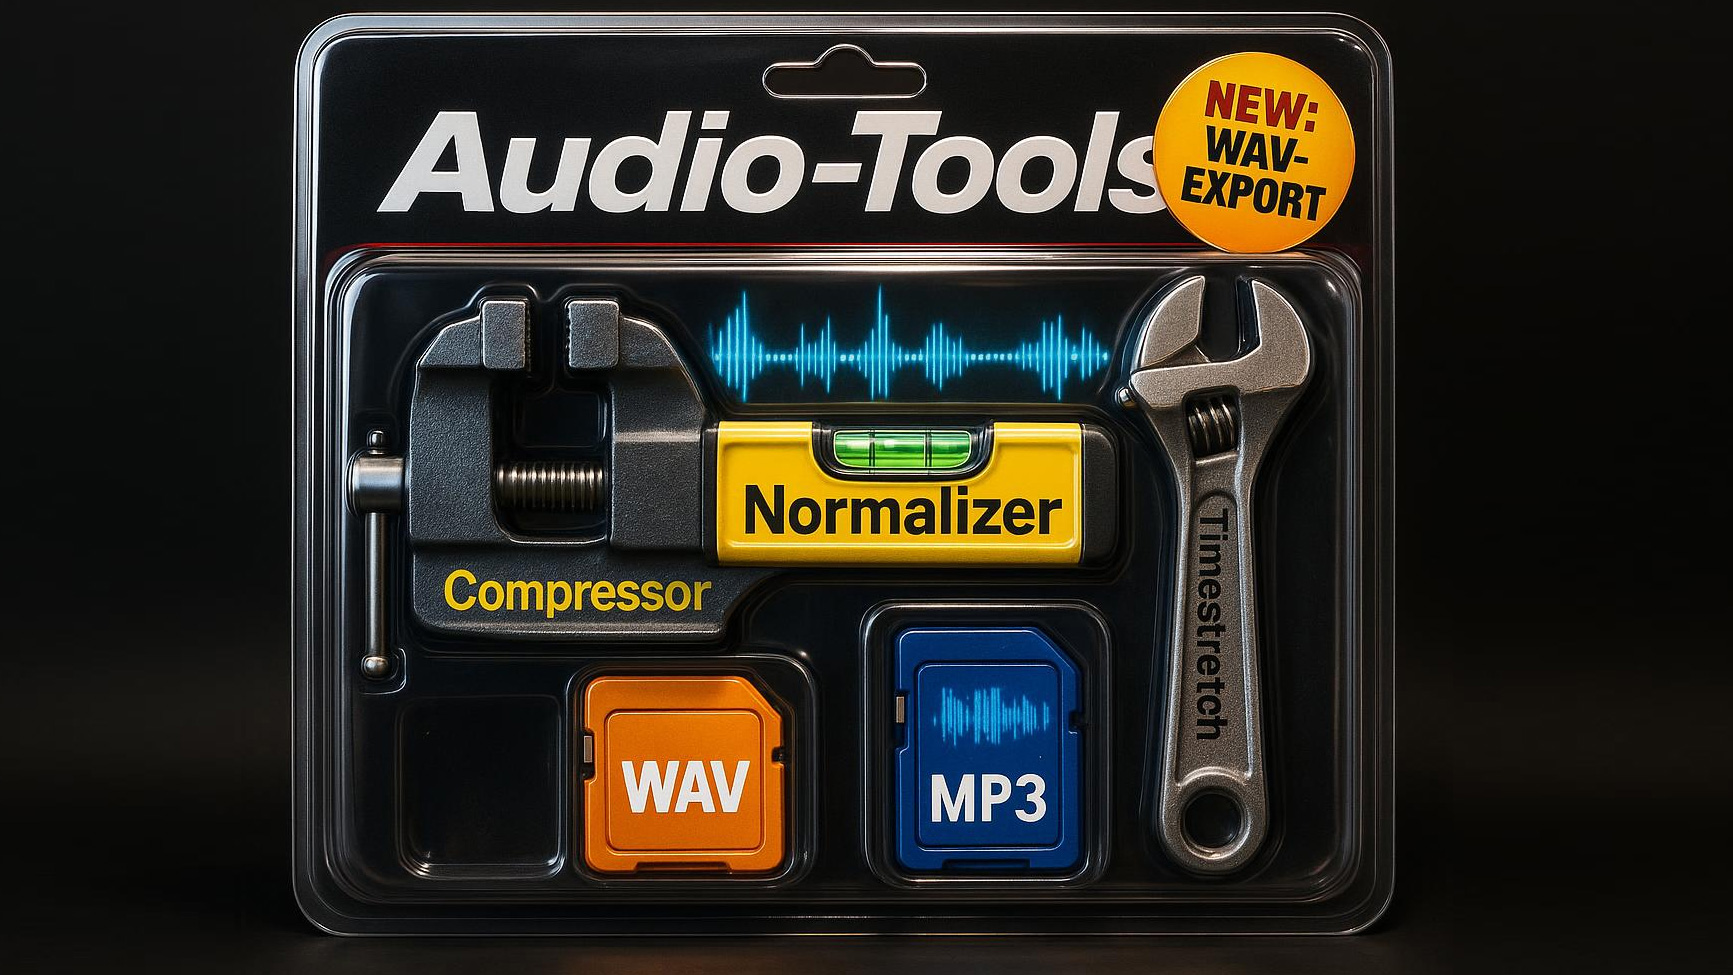
With this toolbox, the AI can help you produce audio content.
You have already seen mixing speech and music in the AI voices section.
With Combine audio, you can merge multiple audio files into a single file. Upload the audio files and arrange them in the correct order using drag and drop.
You can insert pauses between the audio files. For audio processing, you have a compressor, a time-stretch function, and a normalizer available.
For example, you can create an ad break from several individual spots and adjust it to the desired length. You can also choose which file format (WAV or MP3) you want for the audio file.
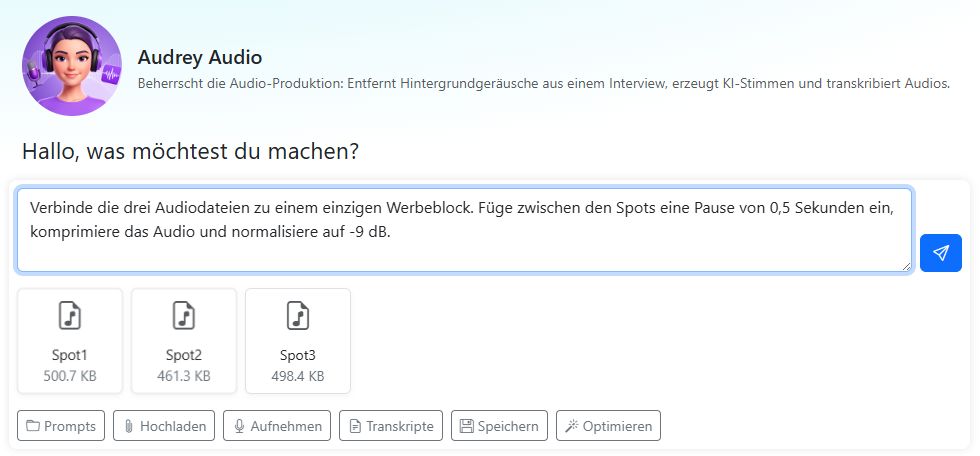
After a short moment, the ad break is ready. It contains the three individual spots you uploaded in the order you specified.
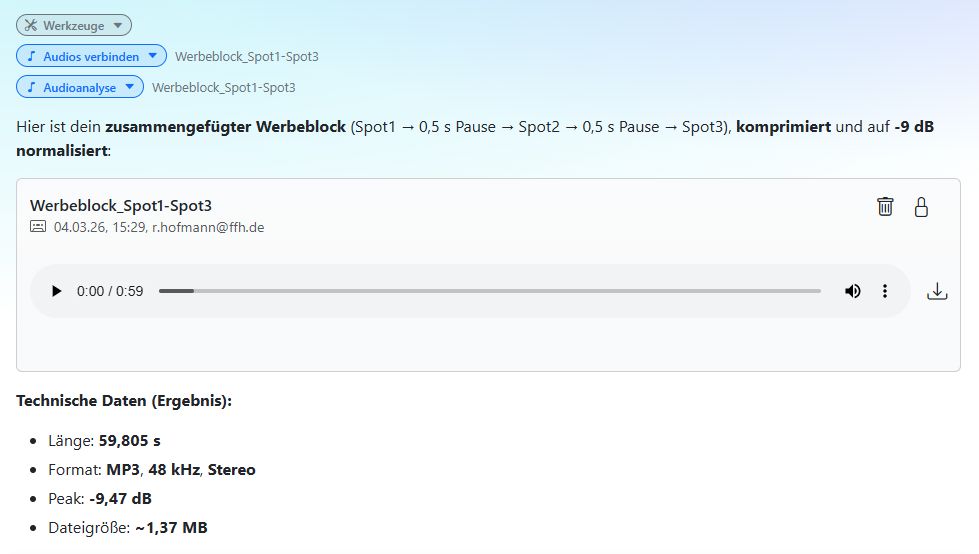
Analyze audio files. The audio tools determine length, format, sample rate, channels, file size, peak amplitude, RMS level, dynamic range, loudness (LUFS), and crest factor. This allows you to assess audio quality.
Tip
Try these prompts:
Normalize the audio file to -10 dB and export it as WAV.
Combine the three audio files into a single file. Insert a 0.5-second pause between the individual files and compress the audio.
Stretch the audio file to a length of 30 seconds. Compress it and export it as MP3.
How long is the audio file and what does it contain?
Analyze the advertising spot technically and editorially. Write a comprehensive report.
Make the audio 5% faster.
Merge the two audio files and normalize them individually.
Combine the audio files and then normalize the entire audio to -9 dB.
Audio Enhancer#
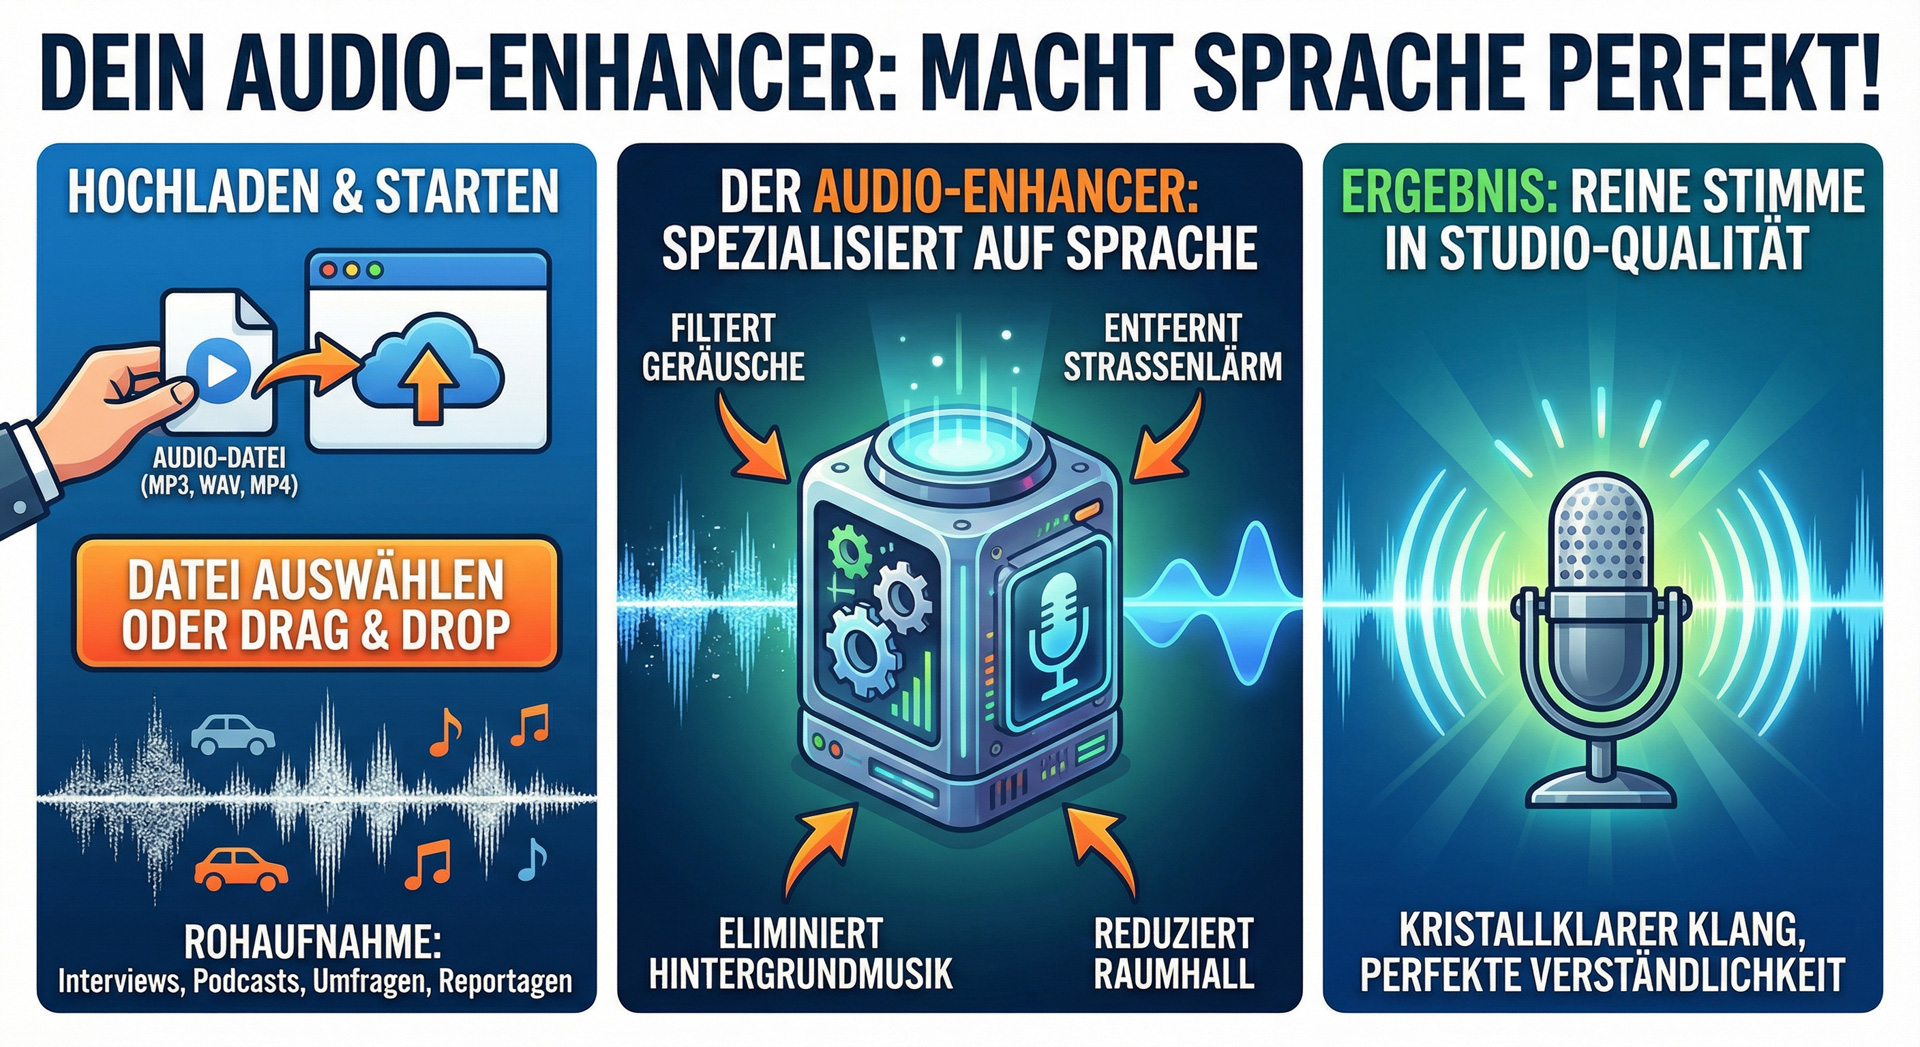
Podcasts, interviews, surveys, features, or other voice recordings sometimes suffer from background noise or room reverb. Background music or street noise may have been unavoidable during the recording.
This is where the Audio Enhancer in the AI-Tools helps you. It can remove unwanted noise, improve speech intelligibility, and optimize the sound. The tool cannot work miracles, but it often delivers impressive results.
It is very easy to use:
Upload the audio file or drag and drop it into the browser.
Give the AI the command: Improve the voice recording.
Audio examples
Typical interview at an event with a lot of background noise.
Advertising spot with very loud music in the background.
Analyze websites with Matomo#
The AI can retrieve, analyze, and visualize your Matomo data. Instead of clicking through Matomo yourself and interpreting data, you can simply ask the AI questions such as: “Which articles performed best last week?” or “Show me how our homepage developed over the last month.”
The AI understands your questions, retrieves the appropriate data, and presents it clearly with charts and summaries.
The analysis options are so extensive that we have dedicated a separate chapter to them: Analyzing website data with Matomo.
Retrieve Facebook & Insta data#
Show me the most successful post of the month. How are we doing compared to others? How is our follower count developing? What can we do better?
Danny Data answers these questions with the Meta tool, which connects him directly to your station’s Facebook and Instagram accounts.
The AI can independently retrieve performance data, analyze it, and turn it into meaningful charts - without you having to navigate Facebook Business Manager or Instagram Insights yourself.
In the article Retrieve Facebook & Insta data, you’ll learn how to set up the Meta tool and which analyses are possible.
Website & web radio report#
The AI-Tools can access website analytics data (OnLineTools) and web radio sessions (onRtools). This allows you to retrieve performance data quickly and create reports.
Enable these tools for that:
Calculator
Thought memory
Generate charts
Website report
Web radio report
Example requests:
Present FFH’s most successful push notifications from the past week in a table.
Show the FFH Simulcast session trend from last Sunday in a bar chart from 5 a.m. to 10 p.m.
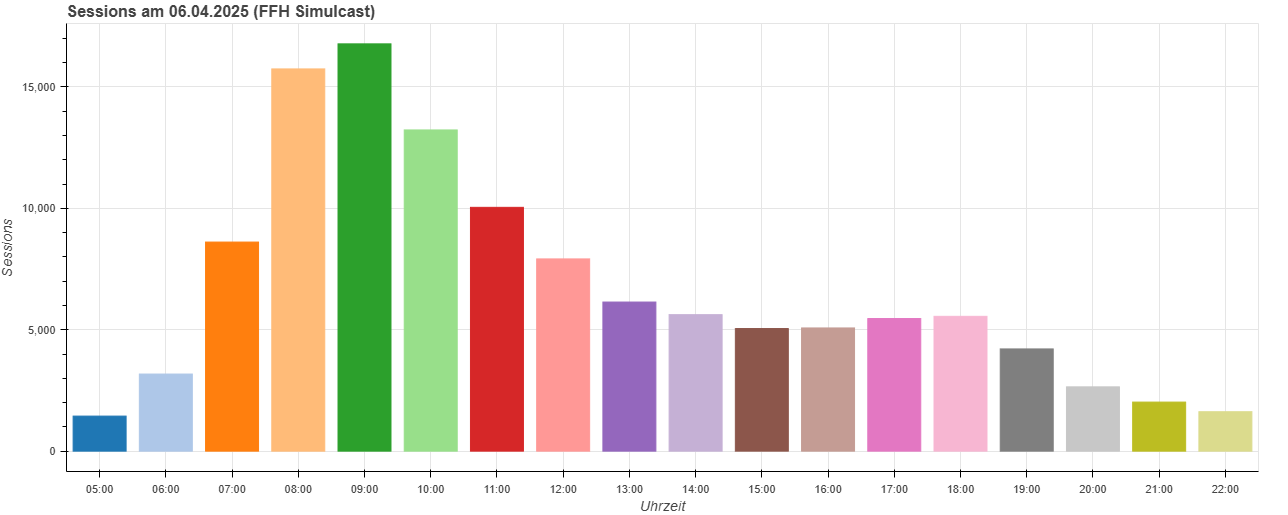
The AI can retrieve the following information:
Website report#
KPI: visitors, visits, total page views, article page views, push notification page views, video starts.
Views by site section, comparison with the previous period and the previous year.
Articles, push notifications, videos.
Time series (day, week, month, quarter): visits, pages, pages via search engines, articles, push notifications sent, push notifications opened.
Web radio report#
Analyses for individual channels or combined across multiple channels.
KPI: sessions, listening hours, average listening duration, share of logged-in listeners.
Tables: sources, platforms, gender, age groups, regions.
Time series (hour, day, week, month, quarter): sessions, listening hours, average listening duration.
Public holidays#
For some tasks, it is important to know the public holidays. For example, when planning campaigns or events, creating editorial schedules, or putting statistics into context during analysis. The AI can look up public holidays for all German federal states.
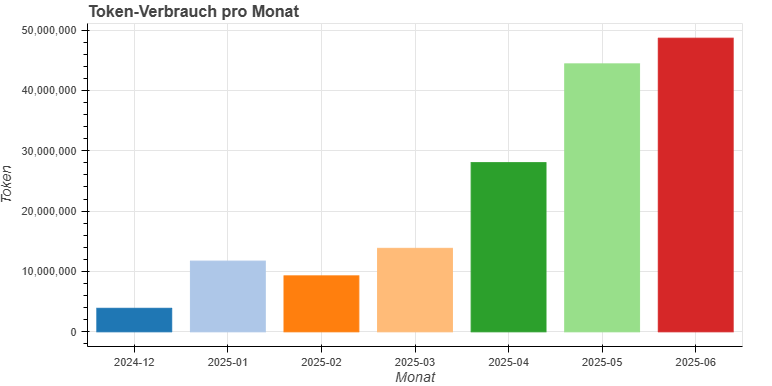
Usage statistics#
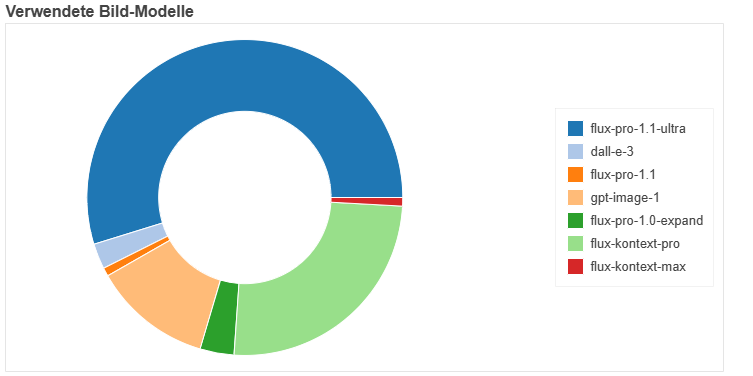
Retrieve your token usage, your current balance, and your image generator usage. Or create usage statistics for your organization.
Only you can see your own usage - no one else can. Organization-wide usage is visible to everyone.
Tip
Try this prompt:
What has my AI-Tools usage been like this year? Show my token usage and image generator usage in charts. Also show which models I have used.
Weather#
The AI can retrieve the current weather report for today and the next few days, including weather warnings. The report is available for many German federal states and regions. The source is the German Weather Service (DWD).
In addition to the weather, you can also get the pollen forecast for today, tomorrow, and the day after tomorrow.
Tip
Try these prompts:
What will the weather be like in Berlin?
List all regions in Germany for which I can retrieve the weather report.
What is the pollen forecast for Hesse?
What weather features are available?
Upgrade: Have weather reports created for any region. Regional Weather is an add-on feature that can be booked in addition to the AI-Tools.
Horoscopes#
The AI can provide daily, weekly, monthly, or yearly horoscopes for different zodiac signs. You can specify the date for which you want the horoscope. For the wording, you can choose between informal singular, formal singular, or informal plural address. Specify the German federal state for which the horoscope should be created so regional public holidays can be taken into account.
Example: “What does the horoscope say for the zodiac sign Leo this week?”
Create assistants#
With this tool, the AI has access to assistants. It can use it to create new assistants, edit existing ones, or use assistants from the marketplace as templates.
In the marketplace, you can find the Assistant Creator assistant, which uses this tool.
Take a look at what you can do with it: Assistant Creator.
Klicktipp - Lead Enrichment#
Klicktipp is a widely used email marketing and marketing automation platform. Prospects (leads) are created there as subscribers, described using custom fields (e.g. company, industry, request), and assigned tags. Tags are not just used for organization, but also serve as the main trigger for automations and campaigns in Klicktipp.
A new lead usually enters the system with very little information, often just a name and email address. The sales team then has to do its own research to find out who the prospect is, which company is behind them, and what challenges they have before a call or an appropriate response is possible.
This is exactly where the Klicktipp tool in the AI-Tools comes in: the AI automatically researches additional information about a lead and writes the results back directly to the Klicktipp contact as custom fields and tags. This gives the sales team qualified, enriched leads without having to do the research themselves, and helps them prioritize whom to contact first.
A typical workflow#
A prospect signs up via a form on the website.
Klicktipp then automatically creates a new subscriber.
A webhook from Klicktipp triggers a workflow in the AI-Tools.
Based on the available information (e.g. email address, company name), the AI researches additional information about the lead.
Using the function call
klicktipp_subscriber_update, the AI writes the researched information back to the Klicktipp record, for example as custom fields or tags.
The sales team can then immediately see in Klicktipp (or in the connected CRM) what the lead is about and follow up more effectively.
The tool#
The tool provides the AI with the klicktipp_subscriber_update function, which is used to update an existing subscriber:
subscriberid- the Klicktipp subscriber ID of the contact. It is usually already included in the triggering webhook, so the AI does not need to determine it itself.fields- the fields to be set. Only the fields that actually change are passed.tags- optional manual tags to be assigned to the contact (only available if tags have been configured for the organization).
The tool is only available if credentials (username and password) for the Klicktipp API have been stored for the respective organization.
Fixed fields#
A set of general contact fields is predefined and available in the same way for every organization:
Field |
Description |
|---|---|
fieldCompanyName |
Company name |
fieldCity |
City |
fieldState |
State / region |
fieldZip |
ZIP code |
fieldCountry |
Country |
fieldWebsite |
Website URL |
These fields do not need to be configured; they are automatically available to the AI.
Setting up API access in Klicktipp#
Before we can activate the tool for your organization, API access must be set up once in Klicktipp:
Create a dedicated API user with a password in Klicktipp (recommended instead of using your personal login).
Please note that access to the Klicktipp API is only available starting with the Premium plan.
Send us the username and password of this API user together with the configuration of your custom fields and tags (see above).
Tip
Try this prompt once the tool has been set up:
“Research this lead based on the email signature, identify the company’s industry and target group, and update the Klicktipp contact accordingly. Set the tag ‘company-information-available’.”
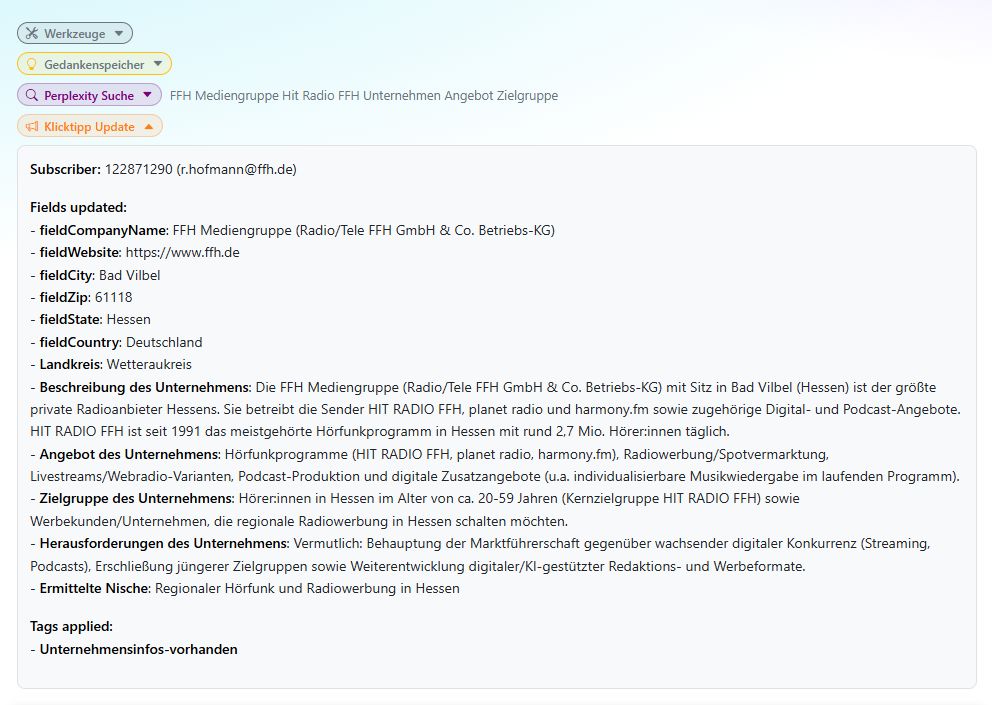
In the following example, we created a Klicktipp assistant and entered an email address and the subscriberid from Klicktipp as input.
We then expanded the Klicktipp Update pill. Here you can see exactly what the AI researched and wrote back to Klicktipp.
Special tools:
- Audio Production
- Voice Recording & Transcription
- Retrieve Facebook & Instagram data
- Channels and brands
- Organic reach and engagement at a glance
- Find the strongest posts
- Examine individual posts in detail
- Track follower growth
- Analyze ads
- Keep an eye on the competition
- Identify patterns and cluster content types
- From data to charts
- Prompts to try right away
- Set up the connection to Meta
- Synchronizing the data
- SEO Analysis
- Analyze website data with Matomo
- Overview of features
- How to activate the Matomo tool
- Top pages and page metrics
- Trend over time for individual pages
- Website development over a selected period
- Analyze traffic sources
- Device analysis
- Hourly traffic pattern
- Live data: Who is online right now?
- Combining it with other tools
- Tips for meaningful analyses
- Example workflows from day-to-day editorial work
- Frequently asked questions
- Try it now!